We finished a great Month of trading at Vtrender Live and am happy to bring to you our report card for the month.
Before that, a quick note to say that all the invitations for tomorrow's webinar have been dispatched . Kindly register in advance so that you can have easy access to the conference centre.
The webinar begins at 11.30 am tomorrow.
We arranged for some extra buffer seats to meet the additional demand. Of the additinal requested, We have about 12 seats remaining . So in case you still want to get in --this may be your last chance.
Here's is the scoresheet for October
( click with your mouse on the sheet and you can move it through the arrow keys on your keyboard )
In a trading world which looks at intra-day trading with contempt, we are happy to project another bench-mark 70 % performance.The Industry considers 7 wins in 10 as a healthy average and we are happy to be on par ( Anybody claiming more should invite suspicion :) )
The calculations are for a single lot on an average. We recommend always a trade in pairs. The above performance would easily better by 40-65 % if you consider it for 2 lots.
Of the 53 Index trades we took in the month, 40 returned as winners with a cumulative 1565 points for the month.We had managed 1069 points in the month of September.
Our favorite Bank nifty returned 1282 points with a 22-6 win loss record in 28 trades.The bank Nifty index in the same period ranged from 12015-12900 and did about 850-900 points only.
Our market profile methodology and order flow techniques have really started to resonate together now and we hope to churn out similar performances.
Cheers.
Friday, October 29, 2010
Options/futures data for 28th Oct (EOD)

Summary: (Looking at Nov series data)
1. For the new series its too early to make any conclusions, so this is just a tracking update. 6200 seems to be the resistance but still not may calls were written yesterday. Quote a few 6300 calls were written yesterday. (Mostly speculative buyers @6300CE)
2. 6100 is a balanced level with 29L calls vs 24L puts
3. 6000 is the support with lots of puts being written there despite SPOT falling well below 6000
yesterday. Also quite a bit of lower level puts are being added@5900/5800. 5800PE has added 17L in last two days and it has the second highest OI (41L) after 6000PE
4. PCR is at 1.2
Nifty Futures:
2.4Cr OI up 38% (67L shares added to OI) -- So in last 3 days we had NET 67L additional shares have been added to Nov series. Strong rollovers/addition with Nifty massacred left and right, makes me conclude these are fresh shorts. Will change my opinion only above 6180-6210.
Banknifty Futures:
15L OI up 20% (2.6L shares added to OI) - Like in case of Nifty, in last 4 days we had 5L additional shares added to Nov series for BN. My conclusion is the same - fresh shorts. Only a rise above 12650 would make me think otherwise.
Thursday, October 28, 2010
Oct Expiry
If anybody had any doubts on how Open Interest rules the NSE trading screen (and our accounts) today's activity in the Nifty spot, particularly in the last hour should put all those doubts to rest.
The Nifty spot price was used to settle positions with the writers of the 6000 CE and the 6000 PE today. It made new lows today, matching the lows of last week and all the time the Nov Future, held the lows of the morning and closed with a 70 point premium !
After finishing off the 6000 CE writers from early morning whose Open Interest at one point reached 12 lacs ( subsequently reduced to 2 lacs) the Nifty made a u turn for the PE writers who at that point had written 22 lacs for a little over 4 bucks. The PE story at 6000 read as 17 lacs reduced from yesterday's close.
Moral of the story : You do not write penny options.
Moral 2 : You do not write close to expiry.
The overall picture is still the same


Options/futures data for 27th Oct (EOD)
Summary:
1. It was mentioned yesterday that expiry would depend on who is the stronger of two - 6100PEs or 6100CEs. Seems like 6100CEs were came out to be stronger of the two. Almost 15L 6100CEs were added, making 6100 a strong resistance for this expiry. At the same time 15L 6100PEs covered. 6200PEs also unwound quite a bit (11L).
2. 6000PEs didn't unwind despite a fall well below 6000 in SPOT, means that expiry will be most likely above 6000.
3. The next problem for bulls is that Almost 13L 6000CEs were added yesterday. The VWAP for the 6000CEs yesterday was around 60 rupees. So an expiry above 6060 will cause pain to yesterday's 6000CE writers.
4. PCR has retreated to 1.18 - but today being expiry day not much can be concluded from PCR
Nifty Futures:
OCT: 1.6Cr OI down 22% (47L shares cut)
NOV: 1.7Cr OI up 42% (52L shares added) - Third day in a row higher rollover to Nov series. The count is now almost 49L additional shares added to Nov series in last 3 days.
Banknifty Futures:
OCT: 8.5L OI down 9% (0.87L shares cut)
NOV: 12.4L OI up 38% (3.4L shares added) -- In last 3 days we have seen almost 5L new shares added to Nov series. As of now I have assumed that they are fresh shorts. If Banknifty manages to stay below 12500 and makes lower lows than 12200, this theory will be validated.
Monthly Charts:
This month/series started off with a gap up to 6065 (Nifty Fut), and we are slightly below that level a day before expiry - needless to say we just had a complete month of consolidation in the 6000-6300 range.


Wednesday, October 27, 2010
Nifty dips
The Nifty began quietly this morning below value and below range.
An effort to move up above yesterday's lows was met with adamant sellers and no buying support which meant a move to the lower part of the trading range later in the day.
We are still playing this as a trading range and are expecting a move up in the later part of the session tomorrow.Meantime our our delta neutral 6100 strategy has notched up around 60 points per lot as of today's close.
Statistically speaking the closing range given yesterday of 6120-6140 for this expiry may not be possible in tomorrow's trade.today's big slide has changed that equation.Any upmove in the Nifty future will meet stiff resistance at 6075 tomorrow.Similar level will be 6100 in Nov fut.
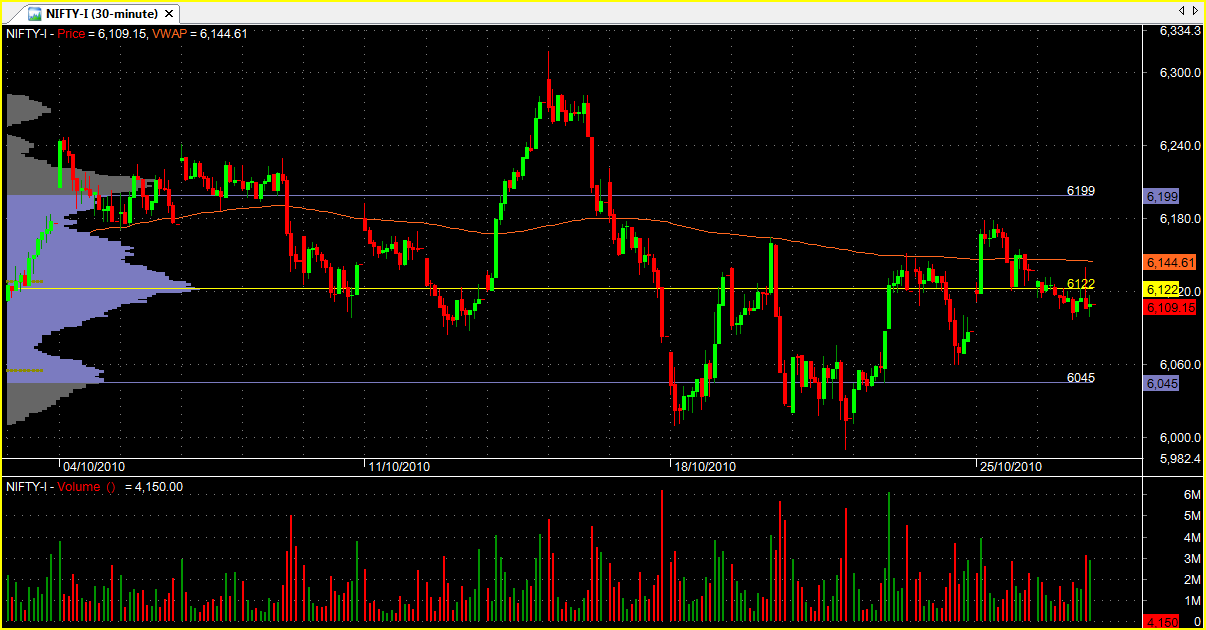
I'm posting charts of the November future.

Bank Nifty did well to close above 12220. This level can be a good buy level tomorrow in Nov fut.

The expiry strategy should be to buy the 6000 call somewhere in the first hour.
An effort to move up above yesterday's lows was met with adamant sellers and no buying support which meant a move to the lower part of the trading range later in the day.
We are still playing this as a trading range and are expecting a move up in the later part of the session tomorrow.Meantime our our delta neutral 6100 strategy has notched up around 60 points per lot as of today's close.
Statistically speaking the closing range given yesterday of 6120-6140 for this expiry may not be possible in tomorrow's trade.today's big slide has changed that equation.Any upmove in the Nifty future will meet stiff resistance at 6075 tomorrow.Similar level will be 6100 in Nov fut.
I'm posting charts of the November future.

Bank Nifty did well to close above 12220. This level can be a good buy level tomorrow in Nov fut.

The expiry strategy should be to buy the 6000 call somewhere in the first hour.
Options/futures data for 26th Oct (EOD)

Summary: -- Actually there is no real change in picture of options from yesterday.
1. 6200 remains the resitance for expiry with 83L OI @6200CE. 6200PEs added almost 6L yesterday and 6L covered today - option writers playing merry-go-round!
2. 6100 remains a balanced level with 58L calls and 52L puts. Expiry now seems to be dependent on who is stronger of the two - 6100CE writers or 6100PE writers. A possibility I am considering for expiry is exactly 6100 +/- 20 points based on options data. The higher end of my target comes close to what Viren mentioned in his post yesterday, the strong possibility for expiry is 6125-6140 given current month POC/VWAP are close to 6120/6144.
3. 6000CEs covering 13L in last 2 days indicates an expiry definitely higher than 6000
3. 6000 remains a strong support for the market till expiry with 78L OI @6000PE
4. PCR is almost flat @1.22
Nifty Futures:
OCT: 2.1Cr OI down 5% (12.5L shares cut)
NOV: 1.25L OI up 46% (39L shares added) -- Higher rollovers for second day in a row, with total of 44L additional shares added to NOV OI. Higher rollovers seem to be happening in the middle of the 6000-6300 bracket. Can't say if these are longs or shorts.
Banknifty Futures:
OCT: 9.4L OI down 18% (2L shares cut)
NOV: 9L OI up 97% (4.4L shares added) - First time we are seeing significantly higher rollovers in Banknifty! This also being in the middle of 12225-12880 band, can't conclude if these are longs or shorts
Monthly Charts of Nifty/Banknifty:
Nifty hovering around Monthly POC/VWAP & Banknifty did fall more than Nifty yesterday.

Tuesday, October 26, 2010
Slow Slide

The Nifty has been able to wrap a lot of traders in tangles, especially those who are anticipatory by nature and do not really listen to the message of the market.
WE know that if a market auctions below value and below VWAP, shorts would give you more profitable results than longs.
In the one upmove the Nifty made above 6120 levels to 6140, the delta was almost non existent and the reversal was quick.
With two full sessions left for expiry it does look like the future would finish between 6125-6140. That's a bold statement and lots can change in two days, but we are never the kind who have shied away from giving our view of the market.
That in fact is the message we read from the market now and if things change we will let you know in tomorrow's post.

The Bank Nifty looked and acted weaker than the Nifty today.There's lots of algo activity in the Bank Nifty at the moment, working in set patterns, making trading this instrument a mechanical habit.
It remains to be seen whether it can stand up to expiry pressures.
Options/futures data for 25th Oct (EOD)
In case you haven't registered for the Saturday Webinar on Market Profile announced here, please do so. Its your chance to hear Shai speaking about the Auction Theory, Market Profile Basics and also your chance to ask questions and get answers instantly!


Summary:
1. 6200 remains the resitance for expiry with 75L OI @6200CE. Interestingly 6200PEs added almost 7L (Is this suggesting a possible move up?)
2. 6100 remains a balanced level with 56L calls and 51L puts. Expiry now seems to be dependent on who is stronger of the two - 6100CE writers or 6100PE writers.
3. 6000CEs covering massively indicates an expiry definitely higher than 6000 (may be 6100 and higher?)
3. 6000 remains a strong support for the market till expiry with 80L OI @6000PE
4. PCR has gone slightly up from 1.20 to 1.23
Nifty Futures:
OCT: 2.2Cr OI down 8.6% (21L shares cut)
NOV: 84L OI up 81% (38L shares added) -- First time significantly high rollovers to Nov series
Banknifty Futures:
OCT: 11.4L OI down 19% (2.7L shares cut)
NOV: 4.5L OI up 83% (2L shares added)
Monthly Charts of Nifty/Banknifty:
First time in more than a week Nifty managed to cross monthly VWAP, but was not able to hold above it as selling started in the second half of the trading session.
Amazingly both indices are now very close to Monthly POCs (where VWAP also seems to be converging)


Monday, October 25, 2010
Nifty goes up, then down
The strong upmove we saw in the Nifty did have the trappings on a trend day, but the similarity ended at the end of the first hour.
Subsequent failure to go past the IB high meant that the range breakout of 6160 would be tested again- a test which eventually failed.

Value was established higher though and may mean a revisit to the 6180 zone soon.
6124 and 6096 are strong supports and 6222 would be the target above 6180.

The Bank Nifty has got good supports at 12410 and 12310.
The target for the upmove would be 12690 and 12780.
-----------------------------
P.S : Shai's just informed me that the Saturday Webinar is almost 70 % booked.I stress again that we have limited seats and may not be able to entertain late requests.
Market Profile webinar
Over the weekend, we received quite a few emails about the charts Shai posted on Market Profile on Saturday here
If you watched the action from the morning, this upmove began from 6125 levels and halted at 6180 and so far the weakness from 6180 has again halted near 6125.
6125 is the red horizontal line in the chart posted by Shai on Saturday.
I'm positing a screen shot of our trading room charts below.This snapshot was taken earlier in the morning. :

The charts above are the QT charts of the Nifty and the Bank Nifty
The one's below are the order flow charts of the same two indices.
We are having a free webinar on Saturday 30th Oct for all our regular readers to help understand our charts better.
The webinar will start at 11.30 am on Saturday.
The webinar will cover the basics of the market profile order flow theory and we will give you a sneak preview of the concepts we use in the trading room.
The webinar is invitation only. To get a free invite send a mail to vtrender@gmail.com with "Webinar on Sat" in the subject line.
We do have limited seating in the conference room. So the seats will be open to early birds only.
Shai will send out a detailed mail on Wednesday with the meeting agenda.
Options/futures data for 22nd Oct (EOD)
Shai's post here has all the reference levels needed to trade Nifty/Banknifty this week. Also he has explained some of the levels in terms of 'auction theory'


Summary:
1. From Thursday and Friday's action, we can say that options writers are 'totally flip-flopping'. On Thursday we had call covering @6000/6100/6200 and Friday the writers promptly reversed it! To be precise on Thursday total of 42L calls (@6200/6100/6000) were covered and on Friday 28L combined at same strike were added. This indicates the choppiness of the market. May be post expiry we may see a directional move.
2. As per options table, 6100 becomes the intermediate resistance and 6200 the strong resistance.
3. On the puts too we had some flip-flopping but only @6100PE. 6000 still remains the support for this market.
4. PCR too is being subjected massive volatility - back to 1.2 from 1.27 on Thursday.
Nifty Futures:
OCT: 2.4Cr OI down 6% (16L shares cut from OI)
NOV: 46L OI up 22% (8L shares added to OI) - only 50% were rolled over.
Banknifty Futures:
14L OI up 5% (0.7L shares added to OI) - Small OI increase but still long way to reach 28L/35L during SEP/OCT
2.4L OI up 26% (0.5L added to OI)
Monthly Charts of Nifty/Banknifty:
Given that we are entering expiry, a look at monthly charts of Banknifty/Nifty tells that both indices are struggling to cross respective Monthly VWAP
Of the two, Nifty looks weaker as its below Monthly Value & VWAP. Banknifty is above Monthly VAL but still below Monthly VWAP, which is almost close to Monthly POC


Saturday, October 23, 2010
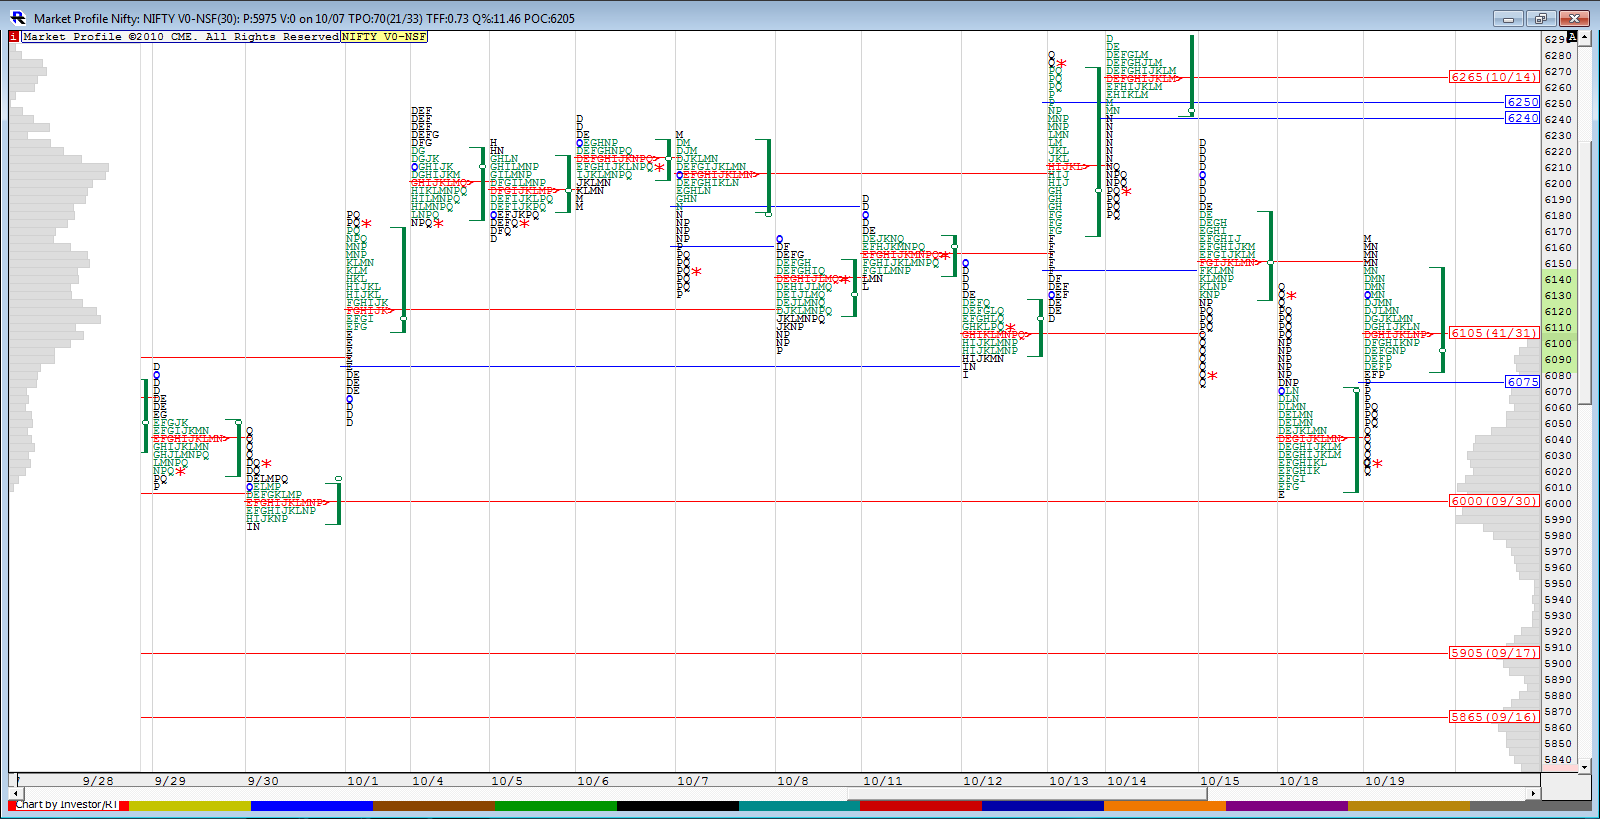
Price Profile Nifty/ Bank Nifty
We put a lot of Volume Profile charts on this blog. Viren's last post here is an excellent example of Volume at price in action.
There is another part to Market Profile based on time-price as opposed to volume-price.
Time- price or Price Profile charts give us a better picture of the larger trend sometimes going inside the candle to see what buyers and sellers are doing.

The above chart is that of the Nifty future as of the close yesterday.
Notice that the candles have been replaced with letters A, B, C, D etc.
Each letter represents a 30 min period starting with A at 9.15, B at 9.45, C at 10.15 and so on.
What it helps to identify is periods where the buyers and sellers agreed on price and periods where they didn't.
So you will notice a lot of letters A,B,C,D, E etc at particular price points and single letters like A or P or Q at other points.
These represent the two extremes of the Auction Process also called Market Profile.
As in a traditional auction, the volume is thickest at the points where the participation is more and thins out as bidders/ sellers outdo each other. You can safely say that the winner of any auction has got the most unfair price in the room.
So in the above chart the Guys who sold at points Q and D on 20/ 21st Oct lost out or got an unfair deal.
The red lines represent the highest volumes for the day also called Point of Control or POC.The market will always gravitate towards the POC from either direction.
The single prints represent the excess of the market or the other side when the market was not fully balanced or away from value.
In the chart above we see single prints at 5985 and at 6315. These represent the extremes of the current bracket.Within this bracket we have a smaller bracket developing between 6000 and 6160. A break of 6000 or 6160 now would be good for an easy 80 points towards the next levels as indicated.
The green shaded letters represent value areas.Value has gone sideways this week indicating a side-ways range.Play the range.

In the bank Nifty charts, 12310 is firming up as an important support above 12225.
12540, 12620 and 12690 represent unfair auctions and overcoming one will take you to the other.
All important levels are marked in the charts.Please keep them for reference.
Have a happy trading week ahead.
Friday, October 22, 2010
Vol Profile charts for 22nd OCT
WE had a double distribution day and a 2I day yesterday with a statistical probability of the high being created in the first hour.
That probability was around 65-70 % based on our understanding of the market profile, but was enough for the Nifty to remain weak after the first few minutes of trading.
Once again the market surprised us by a quick 30 point fall below 6092 levels, only to close right there at the close.

The broader picture still puts this in a bracket of 6040-6250 and the close of today put the market in a neutral zone.
It will be interesting to see which way it tilts from here at Monday's open.

It's been a pleasure trading the Bank Nifty and it's adherence to the levels in pre-market plans makes it a joy to trade.
This index fell slightly short of a close above 12440 levels we watched, but unlike the Nifty, value was created higher today.
Options/futures data for 21st Oct (EOD)
As mentioned several times before, at Vtrender we like to interpret "the message of the market" using a varied range of tools like Market Profile Charts, Order Flow analysis, Open Interest configurations, Risk Sentiments like - Copper, AUDJPY
Today's effort presented here is in identifying the Sellers (Call Writers) @6200/6100/6000 - right from the day we hit 6300+ in Nifty Future. Given that we are less than a week for Expiry, this could be something interesting to track. Wanted to post a 30-min charts of 6200CE/6100CE/6000CE charts but my data feed has data missing from Monday's action. Hence posted the info on Nifty chart


Summary:
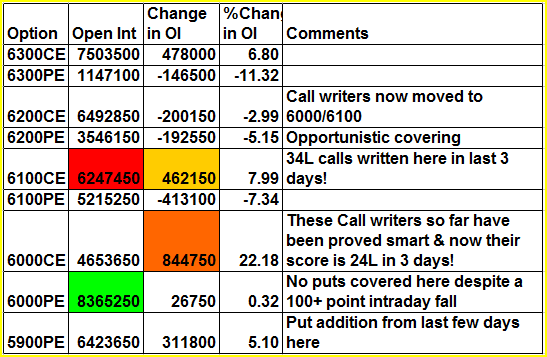
1. What we saw yesterday was a reversal of sort with massive call covering across 6200/6100/6000 strikes. Most calls were covered @6100 (around 21L)
2. 6000 remain as strong support. Although some profit booking happened, addition of 7L 6100PEs makes 6100 a good intermediate support
3. The second picture added shows where the sellers are -
i) 6200CE writers are at higher level -probably above 6225 (Around 5L)
ii) 6100CE writers are probably in the 6185-6225 range (Around 17L)
iii) 6000CE writers are probably in the 6090-6225 range (Around 22L)
The expiry/further rise from here depends on these sellers.
4. PCR has gone up from 1.18 to 1.37 - due to massive call covering & decent amount of put writing. So I will remember that PCR of 1.1-1.2 is the range where fall gets arrested and PCR of 1.8-2.0 is the range where rise gets checked.
Nifty Futures:
OCT: 2.58Cr OI down 3.3% (9L shares cut)
NOV: 38L OI up 15% (5L Shares added) - 4L shares vanished and not rolled over to Nov
Banknifty Futures:
OCT: 13.5L OI down 4%
NOV: 1.9L OI up 17%
Thursday, October 21, 2010
EOD 21st Oct
Today's upmove in the markets was strong above the previous selling area at 6077 and met a bit of resistance at the weekly POC at 6159 regions where the previous seller operated from who took the markets to 5985 levels.

6160 NF represents the middle of the bracket we are observing between 6080-6250 NF and an upmove above 6160 tomorrow shopuld take the market to 6220.
There was once more evidence that price and profile below 6080 had been rejected and 6001 NF held.

In the Bank Nifty we saw a strong defense of the 12225 level and strength above 12370 levels.If the current trend continues, we see 12700 in the index next.
Options/futures data for 20th Oct (EOD)

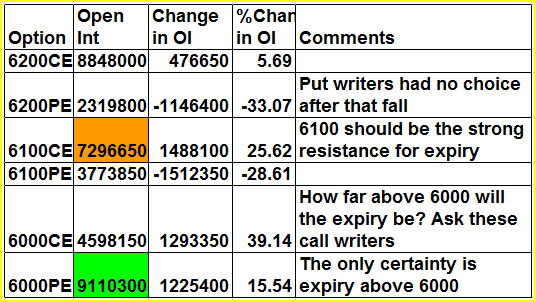
1. Nothing has really changed in terms of trend - aggressive call writing @6000/6100 continues. Even though 6000CEs have added almost 34L in last 3 days - we have not aggressive selling below 6020 yet.
2. With 84L in OI, 6000 is the current support. 6000PEs are not covering much despite the fall from higher levels in last two days. Even 6100PEs are not covering much, which means as of now it looks like there may not be a big downside from here.
3. 6100 is the immediate resistance with 68L in OI but not a very strong resistance given that 6100PEs are also about 53L. 6200 is a proper resistance with 70L CEs vs 32L PEs.
4. PCR has dipped further from 1.22 to 1.18 -- If high PCR of 1.8-2.0+ is a sign of reversal during run up, would low PCR be a sign of fall being arrested and upmove coming?
Nifty Futures:
OCT: 2.68Cr OI up 1.5% - 4L shares added -- Finally, Nifty OI is increasing at lower levels. Even though small increase but nonetheless a +ve OI after being 30% down from its Sep levels
NOV: 33L OI up 14% - 4L shares added
Banknifty Futures:
OCT: 14L OI down 3% - No sign of OI increase in BN
NOV: 1.6L OI up 4%
Weekly profile for Nifty & BN:
Well, I am not an expert like Shai in giving comments based on Profiles - my understanding says that we are developing a b-shaped profile in Nifty & Banknifty. If these Weekly VALs 6001 & 12218 are protected then there is a chance of further rise from here.


Wednesday, October 20, 2010
EOD Nifty 20/10/10
We watched today the Nifty taking out 6001 NF and 5978 NS in the closing minutes of trade only to trade above them at the close

In profile we say that buyers live below Value Low and sellers above value high,
The buyers tried every bit to pull price above 5060 levels since morning, but failed. They were met with aggressive sellers in the closing hour who made the Nifty tank by about 80 points again.
The Order Flow charts we employ, noticed a lack of positive delta around 6070 levels something similar to the one we saw in the Bank Nifty yesterday in that last run up between 12535-12600.
Delta is the difference in the volume traded at the bid-ask between buyers and sellers and is useful to know who is gaining the upper hand at market turns.
We also saw a lack of negative delta in that last run towards 5985 levels, implying that the selling was not done by strong hands and the Nifty future was up 30 points by the close.
However the broader truth of the market is that value was created lower and till price closes up above value high for two successive periods, buyers do not have much of a chance from a Swing Trade perspective.
So watch you value areas closely

The bank Nifty did well to defend the 12225 region, but the seller seems to have established himself at 12370 zones.
All in all, the values posted by Shai in his chart last night still hold good in both the Nifty and the Bank Nifty.
Options/futures data for 19th Oct (EOD)
For reference levels during the fall and possible supports, take a look at Shai's post here


Summary:
1. One takeaway from yesterday's Options table - Call Writers at 6000/6100 were SPOT ON! And they are not done yet - yesterday another 8L added @6000CE & 4.6L added @6100CE. Call writers expecting further downside.
2. Even though call writers are expecting further downside, writers @6000PE are not covering yet. So today might be THE DAY for 6000PE writers to defend 6000 (in Nifty Futures). If they give up and cover then we might see a further slide towards 5900. Speaking of 5900, there has been a steady build up of 5900PEs. It seems now that smart money was already buying 5900PEs while market was climbing 6300+ (in NF)
3. As of now 6100 is the resistance and 6000 the support.
4. PCR has come down from 1.26 to 1.22. This is in stark contrast to last month when used to see "boat loads" of puts being written and PCR was pushing the 2.0 mark!
Nifty Futures:
OCT: 2.6Cr OI down 4% (11L shares cut)
NOV: 29L OI up 10% (2.5L shares added) - very few rolled over.
Banknifty Futures:
OCT: 14.6L OI up 3% -- well I want to seem some OI addition, doesn't matter longs or shorts!
NOV: 1.6L OI flat
Just wanted to end this post with 2 beautiful pictures that convey one message that Viren has been mentioning so many times in this blog "Below Value area and Below VWAP, Sellers are in Control"
Note: These are Monthly Charts


Tuesday, October 19, 2010
Slide
The market has been slippery and sliding to say the least !
We've had some amazing volatility from last week with big trend days and even bigger intra day swings to the long side as well as the short side.
Yet after all, tomorrow's session may be the most important session for the Nifty in a while !
Have a look :

The 6000 level as pointed out in the chart (red horizontal line) will be the last hope for buyers tomorrow.
Beyond that there is a small level of support at 5945 NF which may not hold this time and the Nifty can see 5905- 5865 next.
From the profile point of view, we have seen two rejections of values so far outside the 5085-5245 NF bracket. Today's upmove got rejected at the centre of this bracket at 5164 regions.
Prior to this, the upmove above 5248 to 5313 NF was rejected and the move previously to 6006 below the 5085 zone was rejected.
Today's close is the second attempt to close below that bracket and may find acceptance also, as the selling has been strong.
I generally don't look at spot prices when I trade, but the magnitude of the event forced me to take a look at spot prices to take out the noise in the premium between the two.

On watch is 5978 spot tomorrow.
Girish's Open Interest analysis has so far thrown 6000 PE as a very important support for the market. It has the largest Open Interst which is considered a very big support.
But one close look at the Open Interest table will tell you that there was a larger addition at 5900 than at 6000 PE today. In itself it has a story to tell.
Before closing one look at the Bank Nifty :

12225 is the last line of support below which a minor 12100 can give a small support.
The Bank Nifty can target 11730 on the downside below 12225.
It will if nifty gets to 5900.
We've had some amazing volatility from last week with big trend days and even bigger intra day swings to the long side as well as the short side.
Yet after all, tomorrow's session may be the most important session for the Nifty in a while !
Have a look :
The 6000 level as pointed out in the chart (red horizontal line) will be the last hope for buyers tomorrow.
Beyond that there is a small level of support at 5945 NF which may not hold this time and the Nifty can see 5905- 5865 next.
From the profile point of view, we have seen two rejections of values so far outside the 5085-5245 NF bracket. Today's upmove got rejected at the centre of this bracket at 5164 regions.
Prior to this, the upmove above 5248 to 5313 NF was rejected and the move previously to 6006 below the 5085 zone was rejected.
Today's close is the second attempt to close below that bracket and may find acceptance also, as the selling has been strong.
I generally don't look at spot prices when I trade, but the magnitude of the event forced me to take a look at spot prices to take out the noise in the premium between the two.

On watch is 5978 spot tomorrow.
Girish's Open Interest analysis has so far thrown 6000 PE as a very important support for the market. It has the largest Open Interst which is considered a very big support.
But one close look at the Open Interest table will tell you that there was a larger addition at 5900 than at 6000 PE today. In itself it has a story to tell.
Before closing one look at the Bank Nifty :

12225 is the last line of support below which a minor 12100 can give a small support.
The Bank Nifty can target 11730 on the downside below 12225.
It will if nifty gets to 5900.
Options/futures data for 18th Oct (EOD)
Before starting to get into options analysis, take a couple of minutes to look at what Viren posted here about a mind blowing Vtrender Order Flow System for capturing most of the points from intraday swings.

Summary:
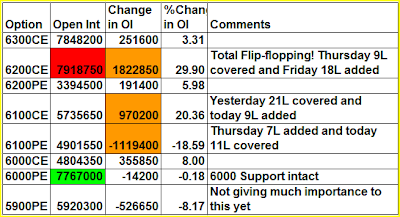
1. As pointed out yesterday, the market did make its way up due to the trapped 6200PE/6300PEs. On the way up, these put writers opportunistically covered (10L from 6300PE/7L from 6200PE) the puts - which to me is not a good sign for uptrend because this rise seems to be due to short covering only.
2. Here comes the next set of thorns for the bulls - On Friday there were 24L 6100CEs were written and despite the rise in Nifty Futures above the 6130, these call writers are not covering and they have added another 5L yesterday! And what's even more worse is the addition of 9.6L of 6000CEs. These are aggressive call writers betting that the rise yesterday was just due to short covering and Nifty may not sustain higher levels.
3. 6200 is the resistance for this market with 67L of OI. The big worry for bulls is trend of writing lower level calls esp 6100CE & it may halt this rise well below 6200
4. 6000 is the support with 83L of OI. And puts are consistently getting added at 5900/5800 - aggressive players looking for a further down move
5. PCR has dipped marginally from 1.28 to 1.26
Nifty Futures:
2.75Cr OI up 2.7% -- marginal but at least some OI increase in last two days.
Banknifty Futures:
14L OI down 4.7% -- No sign of any OI addition in BN -- Just comapre this with almost 35L OI during Aug series and 29L OI in Sep series.
Monday, October 18, 2010
Order Flow System ( preview)

If you have watched this video, posted by Shai here then he has explained orderflow as nothing but the bid and ask prices and quantities which should appear in your trading software.
The big question is how do you get those numbers you see to relect as a chart on your screen? Or how do you interpret them in real time?
At Vtrender live, it's been our endeavor to put you on the cutting edge of the trading world.
We believe that Intra day trading is an exchange between a buyer and a seller and this process, if documented well, should put you on the right side of profits.
Have a look at the above chart :
The chart is that of the Bank Nifty future, our favorite trading tool.
The pane at the very top represents a volume chart, whose ticks are measured by the volume hitting the screen. This is different from the price tick charts we follow.
The next pane represents the buyer-seller pressure at a particular price point.
The pane below that is a histogram with a built in formula to identify if the buyer and the seller is getting aggressive in the market.
And the lower most pane gives you your buying or selling signals, again through a proprietary mechanism developed through years of trading and on screen experience.
If you want to be a buyer you buy when the lines on the bottom pane go blue and if you want to be a seller then you sell when it turns red. If you want to trade, then you turn your existing position when it changes color.
Here's a look at the trade signals generated today :
There were 13 signals generated today in the Bank Nifty future :
Signal 1 : Sold at 12400, covered at 12350 : 50 points
Signal 2 : Sold at 12300 again, covered at 12260 : 40 points
Signal 3 : Bought at 12260, closed at 12310 : 50 points
Signal 4 : Sold at 12310, covered at 12260 : 50 points
Signal 5 : Bought at 12260, sold at 12300 : 40 points
Signal 6 : Sold at 12280, covered at 12250 : 30 points
Signal 7 : sold at 12305, covered at 12250 : 55 points
Signal 8 : Bought at 12260, sold at 12350 : 90 points
Signal 9 : Sold at 12350, covered at 12325 : 25 points
Signal 10 : Bought at 12340, covered at 12400 : 60 points
Signal 11 : Sold at 12400, covered at 12400 : 0 points
Signal 12 : bought at 12400, covered at 12455 : 55 points
Signal 13 : running
So ...
That's an incredible 545 points of profits generated by the system all in one day !
..and what's more the BN system returned a 100 % result on a day which was extra-ordinarily volatile and dominated by the seller first and then the buyer.
Assuming you get 50 % of these signals do you feel you will fail as an intra day trader ?
Even a 100 points generated will put you on the road to profitabality.
Meantime our other calls on the Nifty, bank Nifty, stocks n options continue as usual. This is just our trading room.
These charts and these signals flow live from our trading room everyday.
Yes Shai has made the system bigger and better, to take away all the stigma and losses associated with intra day trading.
Join Vtrender Live to know more !
It's only 3999/- per month and your ticket to consistent profits !
Options/futures data for 15th Oct (EOD)

1. Its been a complete "roller coaster" ride for options writers last week. On the way up to 6300+ (in futures), there was massive put writing and call covering and last two days of the week, it was the exact opposite stuff happening! Best Examples is 6200CEs - around 19L 6200CEs were covered on last Wednesday while Nifty was climbing every resistance with ease and almost 27L 6200CEs were written in last 2 days of the week. With 73L OI @6200CE, 6200 is the current resistance
2. The puts story is more interesting. On 13th OCT, around 20L 6300PEs & 36L 6200PEs were written. In last 2 days, of the 20L 6300PEs written on 13th only 4.7L have unwound. And of the 36L 6200PEs written abount 14L have. So less than 50% of 6200PEs/6300PEs written on the way up to 6300 have unwound so far! From this data I can take a guess that one trip back to 6145-6190-6225 in this week is possible unless all those puts unwind.
3. 6000PEs are merrily adding regardless of the massive fall in last two days. With 85L OI @6000PE, 6000 is the current support.
4. The only red flag in Friday's data is massive addition of 6100CEs. About 23L were added. Need to track this.
5. PCR has reduced from 1.35 to 1.28 but not a very significant change yet.
Nifty Futures:
2.6Cr OI up 1.2% (3.2L added to OI) -- Not big change in OI.
Banknifty Futures:
14.9L OI flat -- despite the mega fall in last 2 days, BN OI has not changed much. So no big shorts are added.
Monthly Chart of Nifty:
Below VWAP, Below Value area - sellers are in control as of now. 6145 the developing VAL for the month will be an important level to watch on pullback. If 6145 is crossed, then next target would be 6211. On the way down, 5980 - previous Month's POC is an important level which might be visited if there is more aggressive selling this week

Subscribe to:
Posts (Atom)

