
Friday, September 30, 2011
Thursday, September 29, 2011

...and the Winner is
I'm done sifting through the various entries we had for the September Expiry closing contest.
Honestly I didn't expect somebody to come so close to calling the series close, especially in view of the dis- jointed movement we have been having over the past few days
But here are the best five entries we received. :
1) Ravi Kumar through email :
Expiry will be near 5000 + _ 10
2) Venkateshan KR through email
Nifty September Series Close expected between 4995-5005
3) Nilesh through Blogger posted here
5034 from me, as it is the lower end of that small range and gap down.
4) Kailash through blogger also posted here
My guess for sep'2011 expiry is 5000 exactly, there may be 5 or 10 points here or there but positions will be at maximum pain @ 5000 so my guess is 5000.
5) Marughar through blogger posted here
5008 is expiry level that what I feel. thanks
Marughar happens to be Zankhu from the trading room.His view was posted last night at 8.00 pm and he held through the down move of the morning.
Congratulations you are the winner!!
As you are an existing subscriber, you just extended your subscription by one month.
We will send you a formal mail confirming the same.
Cheers.
This Is It.
September is done.
We closed at 5015 and there are quite a few guys who have close close to calling it.Off Hand I do remember 2 entries closer to 5005 and 5009, but I will check all the messages before I confirm that.
Once again I want to thank all of you for participating.
We had a great time in the trading room as well with a buy signal at 4930 enough to keep us all in high spirits !!

Overall it was a flat series, with the max returns made by the writers of 500 ce/ pe though some writers of today paid dearly in the end.
I'll post the results of the contest later this evening.
Wednesday, September 28, 2011
September Expiry.
As we head into the last day of the series tomorrow, I want to first take the opportunity to thank all of you for your inputs and the comments and the many emails you have sent for the contest.
Honestly, the volume of mail has been so much that it will not be possible to declare the winner, right after the close.I will go through all the mails after the close tomorrow and we will have a winner, as the prize goes to the closest prediction and not the exact one.
So on Saturday, one person will have in their inbox a welcome kit to Vtrender Live.
You still have time until tomorrow 12.00 noon to enter the contest or to change your entry.
Those of you who have sent me a range, let me remind you that I asked you to call out the series close and not a range. Please refine your entries to a figure, though I'll accept a range of 5 points.
We had an inside day in the markets today, with most of the auction in the volume value area of yesterday.Such days tend to give violent breakouts and a break of value confirmed by a break of the previous day's range is the best way to trade the day tomorrow.
The Vix formula which we employ at Vtrender gives a range of 5022-4860 in the futures for tomorrow, assuming that the vix remains stable for tomorrow and does not jump up and down 10-20 %.
Those who want to look up the calculation can check a post we did on the subject back in March 2010.
There's another simpler way of calculating the day range. This you do by taking the vix and dividing it by 20 and multiplying it to the previous day's close which is further divided by 100.
So you get 32 of the vix divided by 20 which is 1.6, times 4941/ 100 gives us 79 points as the day's movement tomorrow. If vix increases during the day, the range increases.
So within that 5022- 4860, today's profile should put the range to 4961-4880.
But as I said in my post yesterday and as was pointed in the comments section by one of our readers, we are living in times of great disconnect between sessions. So it's best to trade prices off the screen and let the arithmetic of the markets take a back seat.
But for one of you it will do well if you do all these calculations and come close to the expiry figure.
One month of Vtrender Live is the prize.
Winner awaited.
My best wishes....

Tuesday, September 27, 2011

A flat series
As we head into the close of Sept series, the market achieved it's fairest price today.
The fairest price is always a converging developing point of control and a vwap which is a volume weighted average price.
When the two are together, it generally means that buyers and sellers shared honours for the series.
Have a look :

With 2 full sessions to go, the market is conveniently placed.
In the trading room, we have noted the disconnect of one trading session with the next .
The market it seems is playing out in three parts, with a session in the morning from 9.15 to 12.30 , then Europe decides the moves between 12.30 to 3.30 and finally the traders of the US decide the next day's open by playing out from 3.30 pm to 9.15 the next day.
As you can see it's kind of hazardous for me to talk about what will happen 2 sessions from now.
But if you are one better, I invite you to take a guess on the expected series close.
... And if you can do a good job out of it, the closest person will get one full month of Vtrender Live- Our Trading room absolutely for free from the coming Monday !!
If you are an existing subscriber and you nail it, you get for your self one month of credit into your next billing cycle.
The rules are simple- There are only 2.
a) Just call out the series close for September
b) You need to do it before 12.00 noon on Thursday 29/09/11.
You can either post your view here or send a mail to vtrender@gmail.com.
Start thinking...
Monday, September 26, 2011

Trust in the OrderFlow
Another day in the office for our Orderflow...
And another bumper prize.
At last count about 100 points in NF and 200 in BN.


And another bumper prize.
At last count about 100 points in NF and 200 in BN.

Friday, September 23, 2011
Silver's lower circuit
Did you catch that move lower in Silver and Gold?
Our OrderFlow indicators spotted the move of the Sellers early.
Take a Look :

All you need is a knowledge of Price and an understanding of Volume.
That is OrderFlow for you.
Designed to keep you ahead of the big moves of the market!!
Our OrderFlow indicators spotted the move of the Sellers early.
Take a Look :

All you need is a knowledge of Price and an understanding of Volume.
That is OrderFlow for you.
Designed to keep you ahead of the big moves of the market!!

Thursday, September 22, 2011
FnO Datasheet 22--09-2011
Globe is rallying before the key event of FOMC. Rain might be around. Have a rain coat with you.
This is what I wrote in my notes on 20th. Hope all of you had safe trading. My notes:
This is what I wrote in my notes on 20th. Hope all of you had safe trading. My notes:
- It has been bears day out. A red trend day with 4.5% fall in NF and BN.
- FII have sold big today. They have sold 73K contracts, their net OI increasing by 98K contracts. OI increase with price fall generally means shorts are getting into the system.
- Today the equity volumes have been high. FII sold 1400 crore and DII bought 735 crore worth equities. This equity sell off confirms my belief that equity cycle is a delayed cycle to FnO cycle. Huge shorts are created first, then equity selling climax happens where generally profit booking occurs in the shorts. Is this the selling climax, or just the trailer?
- PCR has risen to 1.25 - indicating the hectic activity in the Put Options. 5000PE,5100PE, 5200PE writers ran for cover. 66L contracts have been covered in the above 3 strikes. Around 48L contracts are written in the 3 strikes 4900CE,5000CE and 5100CE. Out of which, 23L contracts are written @ 4900CE, when NF traded almost the entire day above 4900, is a bit surprising. Smart money or Foolish bears - Future will decide.
- Two days back, I said that I am sober about the chances of a breakout. I claimed that we are trading in a range. Two days later, after a 4.5% fall, I still claim that we are trading in a range and I do not find any break down. As an illustration, On 29th Aug, after the second trading day of the series, NF closed at 4933. With 5 trading days to expiry and an entire month of trading, we have closed today at 4913. A 20 point blood bath on the street!! :)
- NF OI has increased by massive 23 lakh today. The price fall indicates that huge shorts entered into the system. In general it does suggest that more fall is ahead. However, an interesting observation is - On 12th Sep, NF closed at 4941 - and has a OI of 2.6 crore contract. Subsequently, 40L contracts ran for cover in the next 200 point rally. And 23L contracts are added again today when we closed at 4913. Looks, 4900-4950 is a major trend decider. People do think that a break down here will lead to severe downfall. Let us see if the second attempt of Short addition in this range turns out to be successful.
- PCR and VIX tell another interesting story. On 26th Aug, the first day of the series, PCR and VIX both were exactly at the same range. We had a break down on that day as well with NF closing at 4748. There was fear all around. We are with the same PCR and VIX, let us see if the second time proves lucky and we break down to abyss. :)
- The OI average price is 4880. We will continue to use this as SAR. You can see that, the SAR indeed worked quite nicely. Yesterday it was at 5096 and a break below it gave 200 points :). Let us continue watching this average price.
- The option volume trading today has been extraordinary. It has been double the average trading volume. FII bought options worth 9L contracts. Their option OI remain unchanged. So, it can not be covering their put writing alone. There has been new put writing of 30L contracts in 4800PE,4700PE and 4600PE. Similarly, there has been new call writing of 55L contracts in 4800CE,4900CE,5000CE and 5100CE. One of these two sides have written options which FII bought. Which side and what are its implications? Let us wait and watch!
- You can find the entire data sheet here.

Trust the Orderflow
We had a trend day in the markets today.
My good friend Viren used to say always- " No target is too big for a trend day "
The day is marked always by a slower open which gives a very small IB , but the momentum picks up through the day climaxing at the very end !
For those of you who are wondering how our Orderflow did on a day like today- well it picked up the short moves on Wednesday itself and remained Red as Buyers were simply out-smarted in price today.

The moves of the market were picked at 5038 on Monday, we converted on Wednesday and Order flow kept us loyal to the trend right through the day 's close today.

Same example in the BankNifty also today.
In sum, if you want to kick the habit of losing money in the markets- just trade the Order flow.
Nifty road Map 22/09/11
To none of our surprise, Bernanke
announced operation Twist late last night.
We knew that one was coming. What we didn’t know was what the market reaction would be to this latest act of the FED. Anyone with any degree of common sense knew that shuffling money between short-term debt and long-term debt was not going to save the world's largest economy. However, markets are often devoid of common sense, so we had to wait for the event to see whether or not the market would immediately recognize the futility of the Fed’s action.
Needless to say the market knew immediately that this was not going to stop the global recession. If QE1 and QE2 where money was printed enormously, couldn’t stop the global economy from rolling over how was shuffling some money back and forth between long-term and short-term debt going to do anything?
Anyways here is a chart of the Nifty for the past three sessions :

On 20/9 we had single print buying off 5034 at the open.
We will wait to see how these buyers react to the gap down, and take cues from there.
Wednesday, September 21, 2011
FnO Datasheet 21-09-2011
"I will be viewing all rallies with suspicion till they convincingly cross 5174" NF made a high of 5173 today. Hope, you were able to benefit from it.
My notes:
My notes:
- Today has been the lowest FII trading volume in the entire series. They have net sold 3.6K contracts worth 88 crore. Though, the trading volumes are less, they have closed positions in 29K contracts ahead of an important event FOMC.
- Equity volumes continue to be minimal. The whole month is characterized by FnO driven rallies and falls. The 16 point premium on NF vanished today completely. As we reach towards the final week of the series, we are still direction-less and the entire game is being played only in FnO segment.
- NF shorts are running for cover. Today another 12L shorts covered today. It is interesting to note that, the series high OI is on 13th Sep, when NF closed at 4941. Today, after a 200 point rally @ 5141, approximately 25% shorts ran for cover.
- PCR has slightly decreased today to 1.15. Though, there is a fall of 60 points from the day high, not much call writing is visible any where in the option table. The fall has been used by call writers to get out of their positions. A meagre 2L addition of 5200CE is the notable part. On the other hand, put writers continue to be aggressive. The continued writing at 5200PE is evidence for it. The most striking aspect of today's option table is the 11L writing @ 4800PE at Rs.6-8. Why 4800, when we are trading 300 points above? A bit perplexing. FII option writing volumes today are not very high - so it may not be them. Who else?
- FII average OI price fell slightly by 6 points and reached 5096. We can continue to use this number as SAR. Yesterday, the number was 5104 - and the fall getting arrested from 5113 may not be completely unrelated. :)
- Where do we go from here? The 5000PE with 93L OI, should provide solid support on any down side. On the upside, I do not see any major resistance. The Fed Meeting tonight might provide the direction. Remember the 5174 number - a clear sustenance above it might lead to a 5350 expiry!
- Will we have the NAV management? Will global cues prevail up on us? "So, the violence might increase - and wild moves might start appearing - but I do not see a clear direction appearing to the market till the closing stages of the series." this is what I wrote in my notes on 13th Sep. As you can see, we are 6 trading sessions away from expiry.We are closer to finding the answers.
- You can find the complete data sheet here.

Nifty Road Map 21/09/11
Nifty Future September series :

Perspective : All eyes will be on the FED as it announces it's decision at 11.45 pm our time.Whilst there is no expectation of a QE3 from the markets, pushing the can down the road like they did at Jackson Hole Last month will not help matters. Expectations are that the FED may announce a swap of shorter term government securities to longer dated ones, the size of which should be in the region of $200-$500 billion.
There is usually a modest drift higher the morning of FOMC meetings, then two or three violent whipsaws immediately after.
The day of the decision has been positive 5 out of 7 times, while the day after was positive only 2 out of the 10.
Back Ground : Bracket between 4910- 5170
Chart Speak :
2) Structure above 5130 needs a bit of repair and further auction.
Tuesday, September 20, 2011
FnO Datasheet 20-09-2011
My notes:
- For all the mega rally that we have today, FII have net bought 100 crore today. Definitely does not look like an FII induced rally. Even if they have, they have day traded today. Further, they are reading the notes here daily, and planned to such a degree that, they have closed sufficient shorts and created approximately same number of longs, so that the OI does not change much. :)
- Equity Buying is still on very low volumes. In fact today, DII have net sold equities. So as such, this rally is induced in the FnO Segment and continues to stay so. Till this is backed up by significant equity buying, please be careful with your positional longs.
- PCR has decreased slightly to 1.18. The underlying theme for the entire day has been the Put writing at will and Call Covering in panic. Most notable is the addition of 45L addition of OI at 5000,5100,5200PE. 12L addition of OI at 5200PE, when NF closed around 5158 is a point of concern. Bullishness bordering foolishness, and is causing some uneasiness in me. :) In fact there is not much resistance to bull rally in any of the upper strikes, so, if this is a genuine rally, look forward to a 5400+ expiry.
- Remember trading is a game played on perceptions. I have been looking at various forums and blogs for the last couple of hours to find how we have a genuine breakout today - and - a new high - targets of 5300-5700-7000 targets are flying around. The Desi MO is at a healthy 56. So, people are reasonably bullish. But forgive me for staying sober. NF has closed at 5157 today. On 8th Sep, NF has closed at 5155. So, after 12 days of trading we have a mega breakout of 2 points. Reason to be really bullish. :) We have not even scaled the 8th Sep day high of 5174. As I said in my earlier notes, I will be viewing all rallies with suspicion till they convincingly cross 5174.
- NF shorts ran for cover today. Approximately 8L OI has decreased. It is interesting to compare the OI of 8th Sep and today - the days where NF closed the same. On 8th, we have 2.6 crore OI and today we have 2.2 crore. So, approximately 40L contracts - around 25% shorts have covered in the mean time. At the same time, FII have reduced their OI from 6.9L to 6.3L contracts - around 60K contracts which is 10%.
- Now, where do we go from here? the option table represents a completely bullish picture. No CE writing is large enough to hold and 5000PE at a whopping 95L OI. Has the NAV management started? If it is - may be we have done 20% of the rally - we get around 500 points in the last 10 days of trading at quarter end. One silly question that has been lingering for the last hour or so is... Have we made a double top on 8th Sep and today?
- The average price of FII OI has changed to 5104 today. So that becomes our SAR. Interestingly, on 8th Sep, the average OI price was 5131. Globe is rallying before the key event of FOMC. Rain might be around. Have a rain coat with you.
- You can find the entire data sheet here.

Trust in the OrderFlow
Here's an easy way of kicking the habit of losing money in the markets...
Just follow the orderFlow :
Nifty :

Bank Nifty :

Just follow the orderFlow :
Nifty :

Bank Nifty :

FnO Datasheet 19-09-2011
"I will not be surprised if we get a ranged movement in the next two days - where option premium gets killed."
This is what I wrote in Friday notes. Most of us at the trading room wrote some options or the other. Hope you could get benefit out of it. My notes:
This is what I wrote in Friday notes. Most of us at the trading room wrote some options or the other. Hope you could get benefit out of it. My notes:
- Yesterday is the lowest volume day of the series for the FII. This was evident with the snail paced movement of the index during trading hours.
- The NF OI has decreased by 1.8L contracts - nothing changed much there.
- The PCR has increased to 1.20. The increase in Put volumes indicating the bearish sentiment increasing.
- I hope you have noted the fight between buyers and sellers around the 5046 number, that I have written in the last note.
- The most interesting part of yesterday data has been the average price of FII OI. It has significantly reduced from 5046 to 4989. It is a bit perplexing - considering the low volumes of yesterday. I have to admit that I could not figure this out correctly. From my present understanding, FII have covered some shorts from the top. Let me illustrate my thinking with a small example. Suppose, I am long from 4800 with 5 contracts and short from 5200 with 5 contracts. My OI is 10 contracts and average value is 5000. Suppose, I close 2 short contracts. Now, my OI is 8 contracts and average value is 4950. You can see that the average OI value has got down considerably. Extending this example, I am deducing that FII have closed some shorts yesterday. I may be wrong.
- So, now the SAR figure changes from 5046 to 4989. We will keep tracking this number. Let us look forward to what clues it will provide us for trading.
- You can get the entire datasheet here.
Monday, September 19, 2011

Nifty RoadMap 19/09/11
Nifty Future September series :

Perspective : The market is moving largely within the 4910 to 5170 range all through this series.5030- 5050 has been the center around which the next 100 points have come about.Trading is very emotional at the moment dominated by news flow which has taken the market up and down 50-70 points randomly. We continue to wait for the bracket to resolve.
Back Ground : Bracket between 4910- 5170
Chart Speak :
1) The day was auctioned at the previous HVN of 5118
2) Support at 4975 barely held, but the seller was prominent above in the previous sell zone
3) Visible selling prints at the top of Friday's profile
4) 5015- 5037 will be watched for signs of buyers
Sunday, September 18, 2011
FnO Datasheet 16-09-2011
"The 16th RBI meet and 21st Fed meet might provide some direction. Another possibility is one or both the events might prove to be non-events. "
And
"So, the violence might increase - and wild moves might start appearing - but I do not see a clear direction appearing to the market till the closing stages of the series."
This is what I wrote in my notes on 14th. Hope the analysis was useful to you. My notes:
And
"So, the violence might increase - and wild moves might start appearing - but I do not see a clear direction appearing to the market till the closing stages of the series."
This is what I wrote in my notes on 14th. Hope the analysis was useful to you. My notes:
- FII have day traded on Friday. They have net bought 3K contracts - and their OI has decreased by 25K contracts. A further case of long liquidation/short covering.
- FII have traded with large volumes on option front. Friday Option Volume is highest in the series. Clearly, the Institutions want to capitalize on the Premium decay in options over the weekend. I will not be surprised if we get a ranged movement in the next two days - where option premium gets killed.
- PCR has decreased to 1.09. Most notable is profit booking at 4500PE. Option writers are playing for a ranged market with slight positive bias. For me the most surprising is 11L OI addition at 5100PE and 5200PE. The most logical explanation that I can think of is ... they are covered puts. As it is FII are hugely short in the Future Segment as we have observed over the series - and these puts are covered puts.
- Where do we go from here? In the data sheet, I have introduced a new column average price. You can see that, the average lot price for the OI of FII is 5046. It means that FII are holding 6.35L NF contracts at an average price of 5046. Are they long or short? We may not know immediately. But it might help to use that number as an SAR. Stay long above 5050 and stay short below it. That will help you stay on the side of Institutions and which has a greater risk-reward ratio.
- You can find the entire datasheet here.
Friday, September 16, 2011

MCX OrderFlow Signals
Here is an example of how a good day trading the OrderFlow at the MCX can change the look of your account.
Copper :
 A total of 3.7 points.
Message : Sell COPPER @ 416.95 at 19:33:27
Crude Oil :
 A total of 145 points
Message : Sell CRUDEOIL @ 4253 at 21:42:10
Gold :

Over 1400 points in 2 trades
Silver :
 Around 3000 points in 2 trades
And our subscription starts at INR 3999/- only for a month !!
Copper :

Message : Sell COPPER @ 416.95 at 19:33:27
Crude Oil :

Message : Sell CRUDEOIL @ 4253 at 21:42:10
Gold :
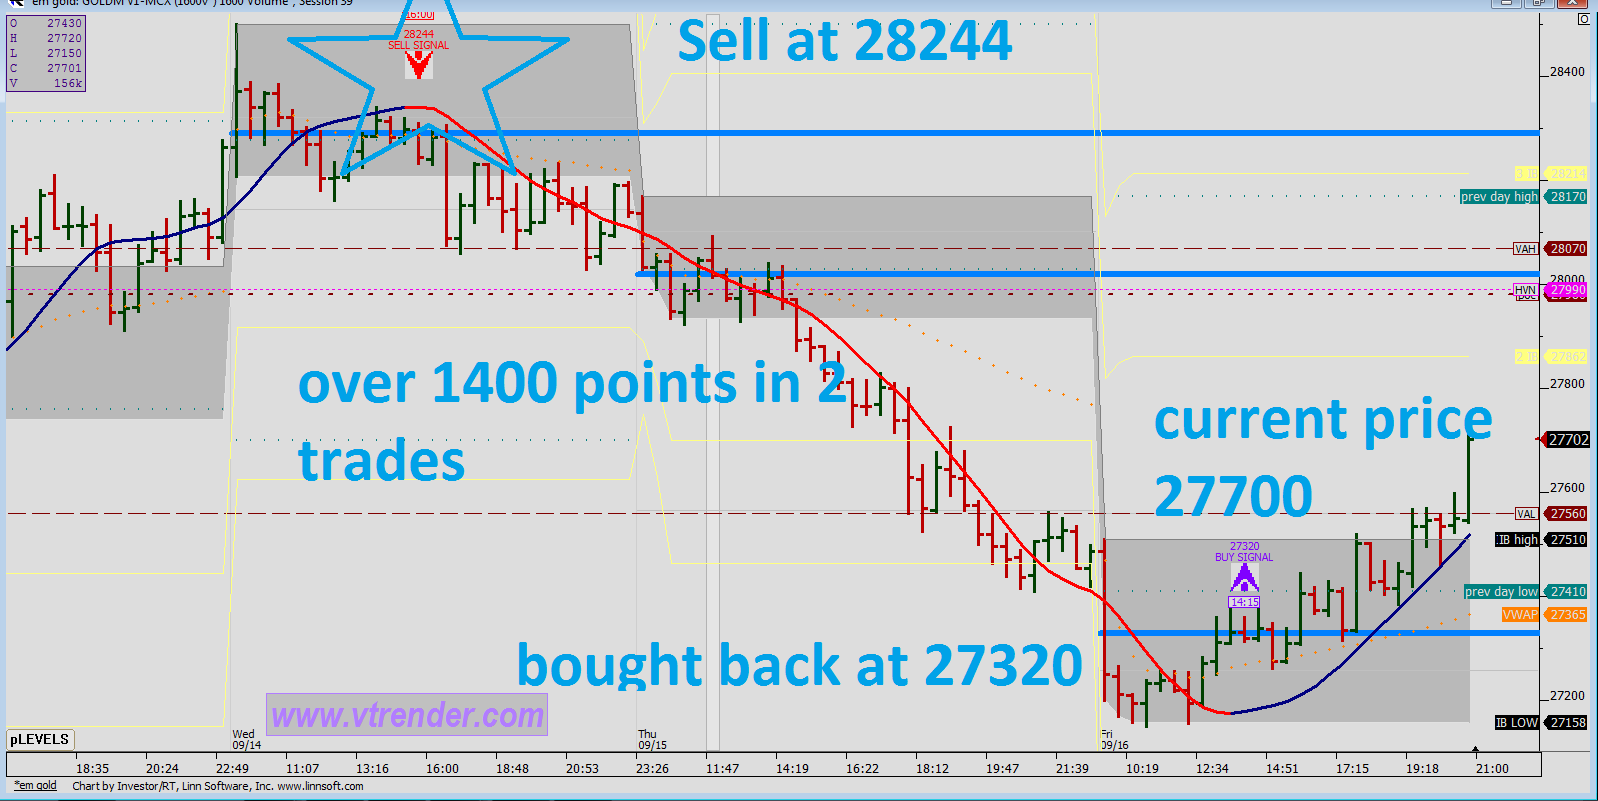
Over 1400 points in 2 trades
Silver :

And our subscription starts at INR 3999/- only for a month !!
FnO Datasheet 15-09-2011
Another highly volatile day. An absolute short squeeze was on from the morning. My notes:
- FII net bought around 10K contracts. However, their OI has decreased by 50K contracts. So, there is significant OI reduction. We have to see whether the OI reduction is due to the long liquidation or short covering. Probably, it is long liquidation if they are covered in the afternoon and short covering if covered in the morning. :)
- There has been significant short covering in the NF. There is a reduction of 13L contracts. Looks like the weak bears who were expecting the 4500's are running for cover now.
- The high VIX is not helping either. The option premiums are not decreasing - and NF is doing bi-directional moves of 100 points very easily. So, people are getting quite confused on to the next move.
- The defining aspect of the data is the equity volumes. No buying there at all. Now, is this rally induced to flush shorts or genuine FnO buying happened - is what we have to look at. We will get further clues in the next few days.
- A rally before a key announcement has to be always looked at with suspicion. With such a key announcement pending today, a rally of 1.5% does not look right to me. Do some people have the ability to see through sealed covers? Or is it the standard "Buy on Rumor, Sell on News" technique? We will know it today. :)
- Where do we go from here? As I said in yesterday notes, I will look at all rallies below 5200 with suspicion. The rally yesterday was not backed up by any commitment by Institutions in the form of equity buying. The high premium of 22 points on NF is an indication that, the rally is induced in the form of FnO segment. Will we get a follow up or not is the key question. We will know it soon.
- PCR stayed almost the same. The Option table gives the snapshot of a picture of beaming bulls who think the bottom is in place. With 70L+ OI at each of the strikes from 4500PE to 5000PE, looks like there is reasonable support at every strike. But the most obvious is the most deceiving in stock markets. Be cautious.
- You can find the entire datasheet here.
Thursday, September 15, 2011

FnO Datasheet 14-09-2011
" A scare to the 5000CE writers looks a probable option." This is what I wrote in yesterday notes. Hope you are on the right side. Here is my notes:
- FII have net sold 23K contracts again. So, looks like they have created more shorts at the higher levels. However, one interesting thing to note is their OI has decreased from 7.32L contracts to 7.12L contracts. There are two ways to look at this. Firstly, we can consider it to be short covering. Secondly, we can consider it to be long liquidation which they have been carrying from much lower levels. As of now, let us consider it to be short covering.
- In this series, the equity volumes have completely dried up. That is probably due to the lack of direction in the market. FII have sold 550 crore and DII have bought 44 crore of equity so far this month. Add to this - 12K crore selling by FII in the earlier month. These are not the best times for investors.
- PCR has decreased slightly from 1.14 to 1.12. The option table has been given a complete makeover from green to red today. More than 50L contracts of Put writing happened in 5 strike prices. 4700PE,4800PE,4900PE,5000PE and 4100PE. The addition of 11L contracts at 4100PE is sure to rise a couple of eye brows. I do look at it as the frustration of PE writers considering the hardships they have been going for the last month or so. Nothing alarming - PE writers wanted to pocket some peanuts. :)
- The volatility is causing the writers on both sides really sweat. The 5100CE writers covering the other day and today's 5200CE writers covering are examples. The volatility is operating at extremely high levels of above 30.
- NF OI has decreased by 10L contracts. First significant short covering in the month.
- Do not let the extreme volatility fool you. This market is going nowhere - and is completely directionless. Institutions are making good money by writing options on both sides. To illustrate the point - NF closed @ 5003 on 30th Aug. After 15 days of trading, today NF has closed at 5019. A mega rally of 16 points.
- By operating via the option market, FII are making it very subtle. Consider the scenario - On 30th August, when NF closed at 5003 - the 5000PE is costing Rs.123. You write an option there - and on 8th September, it went down to Rs. 65 - approximately 50% gain. By making this buy/sell on the option front than on Future front - lesser alarms are raised for the observers. To illustrate further, add a converse transaction of 5000CE buying on 30th August and 5000CE writing on 8th Sep to the above transaction. Considering the way option data is delivered to us - we will find it as 1 option bought and 1 option sold on 30th August - and 1 option bought and 1 option sold on 8th Sep. Nothing to be decoded - except a 200% profit to the institutions. :)
- An important aspect to be remembered is on 30th Aug, FII OI is 5.07L contracts and today OI is 7.12L contracts. An increase of 2L contracts - remember on most of the days in between, we have traded above 5K. I would consider them to be shorts in the system at higher prices.
- Where do we go from here? Well, for me we will move around with the same volatility for a few more days in the range. The 16th RBI meet and 21st Fed meet might provide some direction. Another possibility is one or both the events might prove to be non-events. In any case, I would view all rallies till the earlier series high of 5174 with a suspicion. If we do cross that with conviction, we may be in for a 200 point rally from there on - considering the shorts in the system. On the downside, not much down fall is required for the institutions. Their average shorts are now working to be around 5090 mark. Any expiry below that will make decent money for them. And any expiry in the 4900-5100 zone will mean huge option premium benefit for the writers. So, the violence might increase - and wild moves might start appearing - but I do not see a clear direction appearing to the market till the closing stages of the series.
- You can find the entire data sheet here.
Wednesday, September 14, 2011

Nifty Roadmap 14/09/11
We are following the movements of the Nifty and the BankNifty as part of a larger profile.
These charts were posted on our premium website Vtrender- 2 last night :
Nifty :

Bank Nifty :

The currency market movements are playing a big role in equity market behavior.
Here is a 30 minute chart of the Nifty futures and the USD-INR.

These charts were posted on our premium website Vtrender- 2 last night :
Nifty :

Bank Nifty :

The currency market movements are playing a big role in equity market behavior.
Here is a 30 minute chart of the Nifty futures and the USD-INR.

Tuesday, September 13, 2011
Hidden information Gems in Nifty options data
For more than a month now I have enjoyed highly analytical and yet somehow also very intuitive analysis from Kris at Vtrender. As part of his post, Kris also publishes a link to FII data in futures and options. I used to maintain a similar sheet myself but stopped doing that once Kris started publishing his much more useful post. One thing that has always bothered me about FII option data however is that there is no separate data for puts and calls - both are clubbed together. Somehow I never looked at it carefully therefore, assuming that option data cannot be of much use because there is no way to find out how much of it is puts and how much is calls.
Those of you who have already read today's post from Kris, would have noticed that he has not drawn much conclusion from today's action - the prime reason being not much net addition in future OI and hardly any difference between yesterday's and today's close in Nifty. After reading his post I again looked carefully at his option data sheet and saw something today that was always there but I was intellectually too lazy to try making sense of it. Pay attention now because not only this is mathematical in nature it might make sense to only those who understand options already.
Given below is option data - buy and sell - of last 2 days only. Apologies for pasting picture of data. I wasn't sure how to paste my sheet here without loosing formatting.

Data in black above is already in Kris' sheet. Data in Red is calculated data once I tried to convert option buy and sell data into an average "Strike price" for that day's buy and sell in options. Change in option OI is easier but what stands out there is clear difference between how change in OI in number of contracts markedly differs from change in OI in total value and that may have some additional insight to offer apart from calculated "theoretical strike price" at which FIIs were active during that day.
Look at 12 September data. It was a highly bearish day and managed to close higher at 4940 only after a late decent pullback. Option data suggests FIIs were buying options at average strike price of 4858 and selling at average strike price of 4898 - a difference of 40 points. On top of that one can also see that while 3000 contracts got added, the value of option OI went down. This probably suggests that on monday, FIIs were buying puts/ selling calls but overall bought back more puts written previously compared to the number of new calls written. If one is writing lesser number of calls at higher strike price compared to number of puts written at lower strike price, one can end up with a higher OI in number of contracts and yet overall higher OI in value. That means monday FIIs were trying to bring down the market and simultaneously trying to benefit by writing calls and covering puts. Clubbed with their net sell in futures and cash, this points to uniform bearish view among FIIs on 12th.
Look at 13 September data. Here Kris' conclusion about lack of direction is clear from option buy/sell as average buy strike is 4925 and sell is 4933 - just 8 point difference over previous day's 40. That means overall FIIs ended up cancelling whatever they did today. Probably sold puts in morning and covered calls, covered those puts in afternoon and wrote calls afresh. Confusing! However relatively "high number of contracts addition in OI + value in OI also being positive but lesser than yesterday" points to net addition of puts if one combines the average strike price (4925-33). Still not sure if those puts were written or bought. One can only look at net sell in cash and futures and guess this is more likely to be put buying (number of contracts added much higher compared to value of contracts added). So FIIs are still bearish on tuesday despite market closing not having changed much. Market now probably has a bigger chance of breaking 4900 going forward this week.
I am not sure if this analysis is correct but I invite my friends at this forum to put their heads to this problem and see if additional number crunching and analysis of option data does yield any useful insights! Who knows, we might be onto something useful here.
Regards
Chandrashekhar
FnO Datasheet 13-09-2011
An absolute indecision day. Indecisive in the sense that, it did not give us any clue on our future journey. Institutions made merry by doing a lot of day trading. My notes:
- FII have net bought 6K contracts, however their OI has largely remained unchanged. However, they traded in decent volumes. It suggests that they have been day trading today. The 6K contract buying did not reduce OI even to that extent means, they have sold 6K contracts extra in the morning @ higher prices. :)
- The indecision is evident in the NF OI as well. NF OI has increased by a meager 75K contracts. Further, NF closed yesterday @ 4942.45. Today it closed @ 4941.60 - An absolute doji. So, more or less it has been a day traders' delight. We had a range of 140 points.
- PCR has increased from 1.09 to 1.14. Slightly bullish in nature. The entire option writing play surrounded around Puts being added at various strikes below 4700 and the call writing @ 5000. The PE writers have been experiencing some bitter moments for the last 40 days or so - which is exemplified in the nature in which the Puts are written - at different strikes from 4400PE to 4700PE. In essence not much conviction is seen in PE writing.
- The 13L call writing @ 5000CE deserves attention. It is hard to think that it can be the smart money. My gut feeling is - it is the over confident bears. We will come to know soon.
- Where do we go from here? Bulls are bears have equally convincing arguments. The certainty of their conclusions is what causes the uncertainty perhaps. :) From my end I can not offer any more conclusions based on today's trading. Even the VIX has a doji. :) Let us wait for the future action to unfold and guide us. "Remember the Bar-O-Meter" is the only piece of advice that I can give you at this moment. A scare to the 5000CE writers looks a probable option.
- You can find the entire data sheet here.

NF today's Order Flow
Here is the order Flow chart for today.
The system generated a buy in the morning at 9.15 and gave us a sell at 12.33 pm.

In all, the system generated 36 points on the buy order and 82 points on the sell order, giving us a total of 118 points in the day.
Please note that these are auto generated signals.
The system generated a buy in the morning at 9.15 and gave us a sell at 12.33 pm.

In all, the system generated 36 points on the buy order and 82 points on the sell order, giving us a total of 118 points in the day.
Please note that these are auto generated signals.
FnO Datasheet 12-09-2011
"Considering the high OI accumulation at 4900PE and 5000PE, there might be a visit there to see how they react. Their reaction more or less determines the series outcome." This is what I wrote in my Friday notes. Well, both of them have been tested today. Hope you are on the right side. Here is my notes:
- FII have sold another 43K contracts today. Their OI has increased by the same amount. So, they have increased their shorts. Not a good sign.
- Not much is happening on the equity front. In the series so far, FII have net sold 42 crore and DII have bought 105 crore. Hardly any buying/selling happening there. However, the huge volatility and wild moves on the FnO front are indicating that the game is being played between the big players.
- PCR has decreased slightly from 1.11 to 1.09. If we look at closely on different strikes, 5000PE writers ran for cover - and closed 10L contracts. 5100PE comes next with 6L contracts. Around 10L addition at 4900CE is notable. However, the most interesting strikes have been 4600PE and 5100CE. Both of them saw huge unwinding. 6.5L contract unwinding at 4600PE is quite surprising. Even if we assume it is profit booking by weak longs, the 8.7L unwinding of 5100CE on a massive down move day is quite perplexing. Do these 5100CE are expecting a gap up tomorrow? I do not know. But still we are 150 points below the strike price. A gap up is probably not the answer. The best answer that I can think of is ... someone played for a ranged movement between 4600-5100 for this duration. They covered their profits today. The high volatility is not making the writer's job any easier.
- Zoom a couple of steps out - Let us look at the picture from 5th September till date. On 5th September, NF closed at 5010. Today NF closed at 4942. A fall of 68 points. During this fall, FII have net sold 1.3L contracts and their OI has increased by 1.04L contracts. So it is easy to make out they are building shorts on every rally. However, during the same period NF OI has increased only by 9L contracts. That is 1:9 which is very less compared to the general leverage of 1:30 or so that FII generally get. :)
- Today's option volumes by FII are also highest in the series. I suspect that either 4600PE or 5100CE covering is by them. Probably that is what will determine future course of action.
- Remember, last series we have expired at 4839. As such we are still above the settlement price. As long as we are above that, bull rally possibility does exist. However, considering the OI accumulation of FII, there is less possibility for that.
- 16th RBI Meet, and 21st Fed Meet are two crucial news events which can effect the direction of the market. I will not be surprised if we do make a short term bottom this week, and do a green rush for the rest of the month to facilitate the half-yearly closing of NAV's. As it is, such long time projections are useless and in fact injurious to your trading account. So, stay in present, and try to play this rough week as expected. We can take things as they come.
- You can find the entire data sheet here.
Monday, September 12, 2011
Another winner from Crude & Copper
Here are the latest charts from Copper and Crude, which are our current favorites for trading.
The downmove in equities, coupled with the upmove in the dollar index has taken some bite off trading Gold and Silver Futures, where OrderFlow is showing mixed moves indicating no clear direction from Buyers or Sellers.
The real move in the markets has been in Crude and Copper.
Take a look :
Crude Oil :

After a 100 point winner on Friday, another 140 points today
Every Point made adds INR 100/- per lot to your trading account per lot.
Copper :

Over 10 points booked in the last signal and the current one has given 4 points already.
Every point made, adds INR 1000/- to your trading account per lot.

Saturday, September 10, 2011
FnO Datasheet 09-09-2011
Hope you were on the right side. My notes:
- What we have yesterday is a hollow correction. The volumes are not great - either in the FnO segment or in the equity segment. FII have net sold 23K contracts, but their OI has decreased by 6K contracts. There are two ways of looking at this - We can consider the correction to be an attempt to flush out weak longs. Alternatively, we can consider this to be just teaser. Our Bar-O-Meter 4850-4900 zone will provide the correct answer.
- PCR has slightly increased from 1.07 to 1.11. Slightly surprising because with a fall, generally PCR has to decrease. However, as the fall is on low volumes, nothing much to think about it.
- When you look at individual strikes - 4900PE and 5000PE have decreased OI by 6L and 4L contracts. Looks a sign of weak bulls exiting. The more important factor is the call writing happening at 5100CE and 5200CE at 10L contracts each. Is it the dumb bears or smart money will decide the future course of action for the series.
- There has been 3.5L contract reduction in NF OI - negligible volumes. So, both sides are confident of future course of action. Monday might provide further clues, as 5000PE and 5100CE writers react when NF approaches.
- Desi MO reduced slightly to 75 - but still in the high end to be careful on the long side.
- Even the equity selling is very minimal - FII selling just enough to produce the fall - and DII did not reveal their hand at all.
- NF was at 5003 on 30th August. Yesterday NF closed at 5052. So, a rally of just 50 points with very high volatility.During this time, NF OI has increased by 30L and FII OI has increased by 1.8L contracts. In general, a price increase with OI increase is generally considered longs entering into the system. So, if our Bar-O-Meter is protected, playing the long side might give handsome returns.
- Where do we go from here? Considering the high OI accumulation at 4900PE and 5000PE, there might be a visit there to see how they react. Their reaction more or less determines the series outcome. If we do get into the 4800's - we may be in for some steep correction. This is September, and quarterly adjustments of NAV's etc. is an important aspect. So, unless global cues present some really bleak picture, we may have a green series.
- You can find the entire datasheet here.
Friday, September 9, 2011

Thursday, September 8, 2011
FnO Datasheet 08-09-2011
It has been 2 weeks into this series and time to sum the series up and over view the complete position.
- We are 9 trading days old in this series. It has been a remarkable series - We made a low of 4718 on the first day of the series. And from then on, apart from a minor 20 point loss 3 days back, we have closed all the days in green. A remarkable rally born out of complete bearishness on the first day of the series. And which changed the complete complexion of the game. From a dismal -45 on 26th August to +95 today on the Desi MO.
- We are approximately 450 points away from the lows. Can we rally more? Ofcourse we can. But let us look at the rally in a different perspective. Let us assume the institutions are playing this game. Both the rallies and drops are profitable when you are dealing with FnO and you are on the correct side. And it costs to be on the correct side for the institutions. The cost is equity buying and selling. To induce a rally or a fall, buying or selling of equities is required. In August 2011, the earlier month, Nifty Futures made a fall of 600 points approximately from 5480 to 4840. For a fall of 600 points, FII have sold equities worth 12600 crore. On a same scale, if you consider this month, they got a rally of 440 points for a buy of 1300 crore. Well, there can be many inferences that can be taken out - but for me, the stand out inference is - they got the rally quite cheaply.
- Let us get a bit more micro. Consider the last 3 trading days. They have net sold 32K contracts worth 800 crore. They could get a rally of 140 points. Well, there are two ways to look at this. The FII are feeling quite left out of this rally or... they are just adding to their shorts at each of the higher levels. In any case it is evident that the rally is not induced by FII. So, now you can take your pick. You can start thinking that FII will chase this rally and we are going much higher or ... Be careful with your longs.
- Zoom one more level. The last 2 trading days have seen the lowest 2 volume days of this series - both in equities and FnO. And we got a rally of 100 points in these 2 days. Yes - we are ahead of the game and now Institutions will chase the retail :)
- Well, where do we go from here? I can only see one way. Do we have a bit more upside? May be - I do not know. Ladies and Gentlemen, please fasten your seat belts. The roller coaster is about to resume its.... We are in for a rough ride for the next week or so.
- You can find the entire data sheet here.
The August data that I have quoted is also available in the above workbook as a different sheet.

Nifty RoadMap
This chart has been posted on Vtrender-2 and we are following it up closely for all the moves of the market
Nifty :

We ae watching the 5080 zone for intital support
Bank Nifty :

The Bank Nifty is auctioning in a relaltively low volume pocket between 9690 and 10025.
9690 is on watch for signs of auction breakdown
Nifty :

We ae watching the 5080 zone for intital support
Bank Nifty :

The Bank Nifty is auctioning in a relaltively low volume pocket between 9690 and 10025.
9690 is on watch for signs of auction breakdown
Wednesday, September 7, 2011
FnO Datasheet 07-09-2011
My Notes:
- Today FII bought 11K contracts and their OI went up by 25K contracts. FII OI is around 7L contracts - it is huge - and we have a big move coming.
- PCR has decreased to 1.04. Though PCR reduction with a rally is concerning, this is mainly because of the unwinding of 4400PE. So, nothing to do be worried for bulls so far.
- The only point of concern for bulls is Desi MO reaching 89. It indicates an overly bullish atmosphere. Though it can go on for some time - let us wait and see what sort of correction comes in. Be prepared for unexpected corrections and tighten your stop losses on the long side.
- You can find the complete datasheet here.

FnO Datasheet - 06-09-2011
My notes:
- FII have sold another 1000 crore worth of futures. They sold 43K contracts and their OI has increased by 47K contracts. Further shorts? We are still far above our deciding zone of 4850-4900. So, we will stay neutral still. However, the OI increase from FII is looking higher and higher day by day. We may have a violent move soon.
- PCR has decreased slightly to 1.14. It is surprising - as generally rallies increase the PCR. On the downside, 4700PE and 4800PE provide good support with 70L+ OI. On the other side, OI at any call strike did not exceed 60L. Option writing is suggesting a reasonably bullish picture.
- On the other day I wrote in my notes that, all dips should be bought above 4900 and all rises should be sold below 4850. We had a dip to 4930 today which is spectacularly rewarded with 130 point rally.
- The VIX is still standing at a very high value - causing concern to the option writers. Buying options at these high premiums is not a good way of trading.
- For the past 4-5 days, we are having highly volatile days with swings on both sides - but the net result is minimal. From 30th August, our net increase in NF is around 60 points - whereas each day we had swings of 100 points atleast on either side. So, an intense fight is on to gain control between bears and bulls. The struggle might continue for some more days.
- Equity selling from DII is taking an interesting pattern. They are selling on alternate days with small buying in between days. Past data shows that, DII sell equities closer to the top. Due to the restrictions on FnO trading for some of them, they will trade only on the equity segment. So, equity selling by DII is not good sign for the market. As we have noted in the trading room yesterday, DII equities plus FII FnO together decide the fate of the market.
- In spite of the gap downs, the bulls have not been really tested so far. We are having a 5K plus closing for the last 4 days. So, as Girish pointed out in the trading room, no M2M money has been deposited from bulls. How do they react when they have to face the heat is probably what would define the fate of this series.
- How do we proceed ahead? Well, my personal perception is... there is no business for anyone to be short above 5150 and long below 4850. Trade the in between range. But be cautious. So far, the FII OI looks shorts to me, and if it is correct, we may have some violent moves.
- You can find the complete datasheet here.
Subscribe to:
Posts (Atom)

