Saturday, December 31, 2011

Desi MO (McClellan's oscillator for NSE) at EOD 30th DEC 2011


Actual % change in near month OI for JAN2012 series is +2.57% 
(The % change in near month OI is calculated in the chart by comparing DEC2011 series OI on 29DEC2011 with JAN 2012 series OI on 30DEC2011.)

Friday, December 30, 2011

Testimonials

... And here are some testimonials as we finish the year 2011.

" It's not what we say, it's what you say about us that helps us to understand better":

----------------------------------------------------
Dear Shai

It has been an amazing journey with Vtrender through the last year as you have evolved using new techniques and absorbing new ideas while retaining your focus on volume based market profile and order flow analytics.Your range predictions with breakout levels has been very precise and a great help in profitable trading. The concept of volume based Power Pivots you have introduced has not only simplified part profit booking but also provides very good half-way entry points in a trade. It has been a wonderful (l)earning experience with constant guidance from you, Girish, Vinod, Manu & last but not the least Kris! Viren's untiring efforts to guide us into profitable trades during the early period of Vtrender experience can never be forgotten.I am thankful to you for creating such a professional trading environment and I am proud to declare that I have become a Vtrender addict now. :)

With best regards.
r m
------------------------------------------------------
Dear Shai,


Vtrender is a very effective system and Shai with his clarity and experience of market is always there for guidance. Excellent market players like kris, girish, vinod, rm, sunita and all others make this room a place to learn a lot about the market. Shai, please continue improving your system - I wish to be a member here for a long time to come. Thank you very much.

Janak
janak@belphegorexecutivesearch.com
---------------------------------------------------------
Here is my testimonial:

"Trading is an art. You need apprenticeship to be successful here. Every one speaks about the superior Order Flow Trading system adopted at Vtrender. For me, the trading room, where some very successful traders share their knowledge and observations and almost make you walk through the market - is a life changing experience."

Regards,
Kris.
----------------------------------------------------------
Dear Shai :

My association with V-trender began around March 2010 and it has been a great experience trading through the very innovative ideas exchanged and helping to understand the ground realities of trading.

The two most important edges of the many edges I gained with my association with V-trender has been:

1) Disciplined trading.
2) Ability to understand why a trade fails or trade wins.

I feel the  above-mentioned two points are required for having a successful trading career.

Regards and best wishes :)
Vinod Kumar

---------------------------------------------------------

Dear Shai,

Always in dreams thought of a unbiased  friendly well wishing trading community with social responsibilities..
Got it because of Vtrender room ..dreams came true..


On MP-shifting to volume profile was the best decision-people hear about algo trading , we see them, track them , kill them

regards 
Manu


---------------------------------------------------------
Hi Shai,

Before subscribing to your site, there was no edge in my trading. It was as predictable as a coin toss. Your trading system gave me the much required edge in terms of precise entry and exit, discipline in terms of tight stop losses and money management and your continuous support resulted in more profitable trades than loss making ones. This is the first year in which I ended in huge profits and this happened within 4 months of following your system, which I could not achieve in 4 years of my trading experience. I really kicked the habit of losing money in the markets.

Regards,
Surya

---------------------------------------------------------
Shai,

First off I want mention that what I can say in just few sentences can't describe what's the real value of Vtrender for me. But here's an attempt:

I have been a member of Vtrender right from day one and its been an exciting journey of learning and earning in markets. What amazes me the fact that at Vtrender innovation just doesn't stop. We had Amibroker charts first, then Quotetracker candlestick, Quotetracker PNF, Investor RT PNF, Order flow in a different pane and finally we have the OF charts which I can definitely say that are the best eyes through which one can look at any market instrument.

And the the other valuable benefit of the trading room is the interaction with fellow traders and benefiting from their knowledge. Kris, RM, Viond, Janak, Manu, CS, Jigs, SN, Moh and quite a few others whom I am very tankful in making trading a lively task that I can wake up and look forward to every morning.


Regards,
Girish

 ---------------------------------------------------------

Dear Shai,

Thanks for one of the best  trading system of the WORLD for trading in Indian stock market . Because of the Order Flow system I could
started recovering my past losses, which were there for few years. I am happy to join your order flow system for more than six months and wish that 
if , I would have joined earlier,  would have been in profits now. Once again Thank you very much for the Order flow system. 
Sharad Gupta


 ---------------------------------------------------------

Hi Shai, and Vtrender trading roomer friends :)

I have found Shai as a down-to-earth, careful, objective but not obsessed analyst and trade coordinator with productive innovations up his sleeve.
It gets exponentially potent when added with Viren's dynamism, Girish's lookout levels, RM's datacrunch, Manu's balle balle spice, Janak's quick crop decisions, and many other knowledgeable participants.
This traderoom holds people with knowledge of various streams, mixing to a profitable cocktail. Each participant holds stuff that others respect to listen. I would take part in this party when i get my time back during mkt hours. Time is my straight jacket constraint. Its an enjoyable atmo here.

with best regards,
mo h

Thursday, December 29, 2011

Desi MO (McClellan's oscillator for NSE) at EOD 29th DEC 2011


End 2011 Offer


Fellow Trader,


If you have been trading these markets for any amount of time, you would have noticed that currently the markets favor traders over investors by a stretch.

Come 2012, it will not change much.

If you are quick, disciplined and in a position to take some risk, there are great profits waiting to be made in 2012.

All you need is a great trading system, some live charts which you can peep into at anytime and a good community to support your decision making,

This is what VtrenderLive can bring to your trading in 2012.
  • -Full Fledged Trading Room
  • -Live Streaming Charts
  • -Live auto generated Buy/ Sell signals
  • -Signals sent to twitter and/or phones
  • -Market Analysis
  • -Trading Range
  • -Live Calls
  • -Trades On NSE Indices & MCX Commodities
  • -Interpretation for trades
  • -Support for existing Positions
  • -Chat Room
  • -Community Support
  • -Private website for subscribers

All this for a nominal INR 3999/- per month only.You can find details of our offer at Vtrender Subscriptions

Since we had a great year and are looking forward to an exciting 2012, we are now sweetening this offer for you.


Here's the deal-

If you subscribe by Dec 30th, the last trading day of this year then,

a) On one month's subscription we will add another 10 days free
b) On 3 months' qtrly subscription we will add another 20 days free
c) On 6 months' semi- annual offer we will add another 30 days free.
d) On 12 months annual offer we will add another 60 days free.


Subscriptions can be sent to the ICICI Bank account given in the link above or paid directly to Paypal links on to your right.

The free days will be calendar days added to whatever subscription period you choose.

So hurry. This is a limited period offer and will end on Fri- Dec 30th.

Monday, December 26, 2011

Desi MO (McClellan's oscillator for NSE) at EOD 26th DEC 2011


Profile check


Here is a chart of the Nifty profile showing two composite profiles from the week 12/12 to 15/12 and week from 19/12 to 20/12.

Both of these composites were balances and will have important implications going forward.

The Profile dated 16/12 shows a move to the top of the balanced profile which failed and resulted  in a [panic bottom, in the next 2 sessions at 4537. It is important to note that again we saw evidence of a failed move producing a fast move in the opposite direction.

As we say at Vtrender often- from Failed moves come fast moves .

This profile will be an important reference point for the market's behavior now.

Coming to the other balanced profile in the chart on 19/12 and 20/12 we are witness to a move which has created value higher. Also note the Buying efforts late on Friday and early this morning in the form of the single prints. The migration of value higher and the single prints at the base of  the profile are pointing to us that buyers continue to dominate the landscape in the short term.

We would have to see if sellers come back into the equation. This will be visible from a value which starts going sideways to down,, single prints at the top of the profile and a close below Value area low.

Till then it is safe to assume that buyers control the short term and any trades taken on the opposite side will be highly speculative.


Saturday, December 24, 2011

Friday, December 23, 2011

Trend 23/12

Here iis the Orderflow chart of today


We got a sell signal when dpoc broke after a failed move to go higher.

The weekly pnf chart showing the week's activity is below.


Desi MO (McClellan's oscillator for NSE) at EOD 23rd DEC 2011


Nifty & Advancing Issues 5 & 10 MA


Wednesday, December 21, 2011

Desi MO (McClellan's oscillator for NSE) at EOD 21st DEC 2011


FnO Datasheet December Series

It has been a wild series so far. November series has expired at 4756. Today, we have closed at 4711. More or less - a nothing series. The statistic is presented just to bring to light the fact that, we are almost overwhelmed with bearish sentiments. Most of the bears calling for a short term bottom yesterday. In this context, I would try to present my notes on December series so far. Again, the notes tries to comprehend the entire series - and will try to put today's rally into that perspective.

  1. To understand December series in a perspective, we have to watch the FnO data from 21st November - 3 days before November expiry. On 21st Nov, FII OI was at 7.43L contracts and by 23rd Nov, it reached a peak of 8.76L contracts. On 24th Nov, after expiry, the OI was at 6.26L contracts - more or less all of them belong to December series. Now, the addition of those 1.3L contracts between 21st and 23rd happened in the price band 4800-4900. Now, between 25th and 28th Nov - the OI has fallen to 5.1L contracts. In this span FII bought 38K contracts - and NF moved in the price band 4680-4750. OI reduction even when they bought - indicating they have covered the shorts taken in the earlier 3 days. 
  2. The second phase to be considered is from 28th Nov to 1st Dec. During the period FII bought 50K contracts - their OI increased by 50K contracts - and NF traded in the range 4750-4850. So more or less longs are added into the system. Then we rallied to 5134 by 7th December. It can be seen that, their OI has not changed much during the time - on 7th Dec, the OI is at 5.5L contracts - more or less the same as on 1st Dec. So, they got decent benefit out of the rally. 
  3. The third phase to be considered is - from 7th December to 9th December. During the period NF has fallen from 5100 to 4950. During this period, FII have net sold more than 90K contracts - and their OI has decreased by 90K contracts. So, they have booked out their longs taken earlier. 
  4. The fourth phase to be considered is - from 9th Dec to 15th Dec. During the period FII have sold 90K contracts their OI has increased by 90K contracts and NF has moved in the range 4750-4920. So this is the price where they have built shorts. 
  5. The fifth phase is from 15th Dec to 19th Dec - where their OI remained unchanged - and they were day trading mostly.On 20th Dec, when NF made a bottom of 4540 - FII have bought only 12K contracts - which showed in the OI reduction - so they have covered their shorts. 
  6. Finally, today they have net bought 66K contracts, however their OI has decreased by 50K contracts. Considering the heavy volumes in the morning around 4620 - we can almost deduce that they have covered their shorts around that zone. So, even today, their buying is mostly short covering - and not buying.
  7. Well - to summarize - firstly you can see that FII are playing our market more as an FnO game rather than any investment opportunity. Secondly, we are oscillating from the mean by 200-300 point range - and we are at the mean position now. 
  8. There are a few other things that are important to analyze this series. FII have been relentlessly selling in equities. They have net sold approximately 8K crore so far this month. From 9th December, till date, not even one day did they buy equities. And, during the period they have approximately sold 2L contracts in Fno - the effects of INR clearly visible.
  9. On the total OI front, this month is quite interesting. We have accumulated an OI of 2.13 crore by Nov 24, the expiry date and that remains the highest OI through out the month. It can be also observed that most of the OI is built in the range 5000-4850 zone and most of the time we have traded below the range. And through out the month, only reduction in OI took place - no significant addition any time.
  10. So finally after all the explanation where do we go from here? I do not know. :) On a serious note - I would want to keep my stand perfectly neutral. Here are my considerations for staying neutral. We are in the all important zone 4700-4800, where most of the action took place. Either from longs to shorts or shorts to longs. The FII OI and NF OI both are at their lowest levels in the series  - and they can be taken any where. Secondly, during the month, in the zone 4700-4800, DII have bought more than 4K crore of equities. If we assume they know what they are doing - they consider this to be an important level. However, it is important to note that most of FII shorts are in the zone 4750-4920 and we have not touched that zone still. Once, we go into that - a short covering might take it to 5K plus expiry. However, till we go into that zone - and see an evidence that shorts are covering - it might be prudent to be biased on the short side. Yeah - we are below the all important 4756 still. :)
  11. You can find the entire data sheet here.

trend 21/12/11

Here is the updated chart to the one which ws posted this morning


One of the basic rules of market profile state that if a markets stays above Value area high, it implies that buyers are in control of the day's action.

4617 which was the value we were tracking was never really broken though it was tested several times.

In the ends, the shorts were forced to cover, as nervousness on global greens prevailed

The OrderFlow was a buy since 9.15 am and the trend is in the chart below.


Market in Balance

Here is a 2 day profile of the NF:


The market is clearly in balance.

2 choices await our trading today :

1) The value area rule which will mean a trip back into the value area from current levels.The 2 day value area is the green lines and it's the current lows of NF based on trading activity at 10.20 am .

2) Break of value and range which should set up the imbalance again.

Remember it's balance to imbalance back to balance.

The Imbalance from Friday has been rectified and we are back in the mood to be in imbalance again.

Tuesday, December 20, 2011

Desi MO (McClellan's oscillator for NSE) at EOD 20th DEC 2011


Mini Composite

Here is a mini composite profile from yesterday's morning session.


a) Shows the market balancing off the big move from Friday

b) shows a small short covering which took the market to gap fill and day highs late in the afternoon.

c) Shows the morning session and early rejection of the drive from noon yesterday.The move down was however arrested at the POC from yesterday.


From the post of yesterday-


"So far this morning we have seen a reaction off the lows of 4565 to 4598 or about 33 points. Still not quite there for the buyers yet.

What I expect to see later is for buyers to step up and take the market to twice reaction target of 66 points. This will show me evidence that buyers are interested at current prices. Failure to do so will keep the swing down"
 
Broader view : 
 
The buyers did show up and take the market to 4598 + 33 = 4631 which was what we expected for the noon session yesterday.The high of the day was 4633 incidentally.
The current activity above POC keeps the small up bias intact, but we need a decisive move out of value and range for the upmove to now continue. This would mean an auction back up above 4633.

At 4561 we saw a failed auction yesterday. Should the market succeed in taking that low out, all bets on the long side will be out.

Monday, December 19, 2011

Desi MO (McClellan's oscillator for NSE) at EOD 19th DEC 2011


Profile check


Markets trend 30% of the time, but these 30% moves result in the most profitable times for day and swing traders.

These are the kind of moves generated by longer time frame players and generally come out of balance zones. They also come 1 or 2 sessions after a neutral day and hence we give neutral days a lot of importance at Vtrender.

The above profile shows a 2 day balance zone between 4730 and 4848 NF.

On Thursday morning, I had tweeted out this message-

4731/42 are lower ends of 3 day balance zone. After a neutral day possibility of new trend is higher

However later that day, the market reversed above the 4731 mark and went through the entire balance area the next day covering what we popularly call the value area rule or the 80% rule.

But there was a reversal later on Friday below 4730 and the markets went into imbalance immediately.

This is the truth of Market profile- Markets always go from balance to imbalance as buyers and sellers jostle for their perception of value.

What happens now?

The gap down open confirms a market still in Imbalance mode. The evidence we want to see if is a D shaped profile showing buyers coming back into the equation.

On Friday as the market moved out of the balance zone it put in an uncorrected swing of 180 points. Such uncorrected swings are generally the start or the end of a new trend.

The biggest reaction on that one way down by the buyers was 4626 to 4660 or about 34 points.

So far this morning we have seen a reaction off the lows of 4565 to 4598 or about 33 points. Still not quite there for the buyers yet.

What I expect to see later is for buyers to step up and take the market to twice reaction target of 66 points. This will show me evidence that buyers are interested at current prices. Failure to do so will keep the swing down.

Looking ahead to the week, a retouch of the balance zone and breakdown level of 4730 if and when it materialises will be another opportunity to get short into the markets.Above that the high volume node of 4848 will be a big resistance as we have seen all through the week.

For the day time frame players, we are watching 4624- the gap fill zone and the high volumes at 4627 for reactions. Lower down our immediate targets for the day are 4536 and 4523.

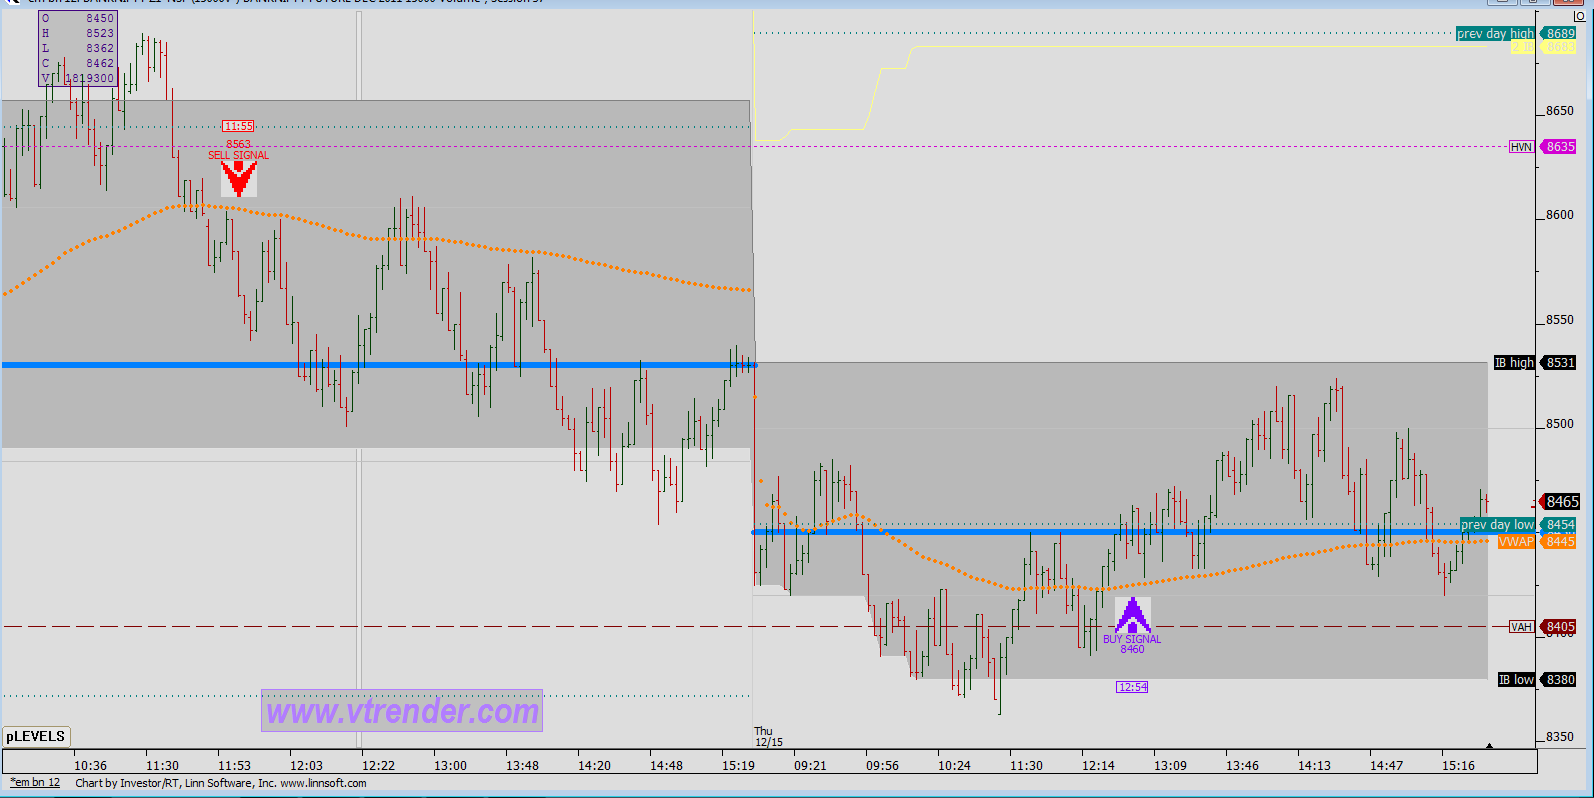
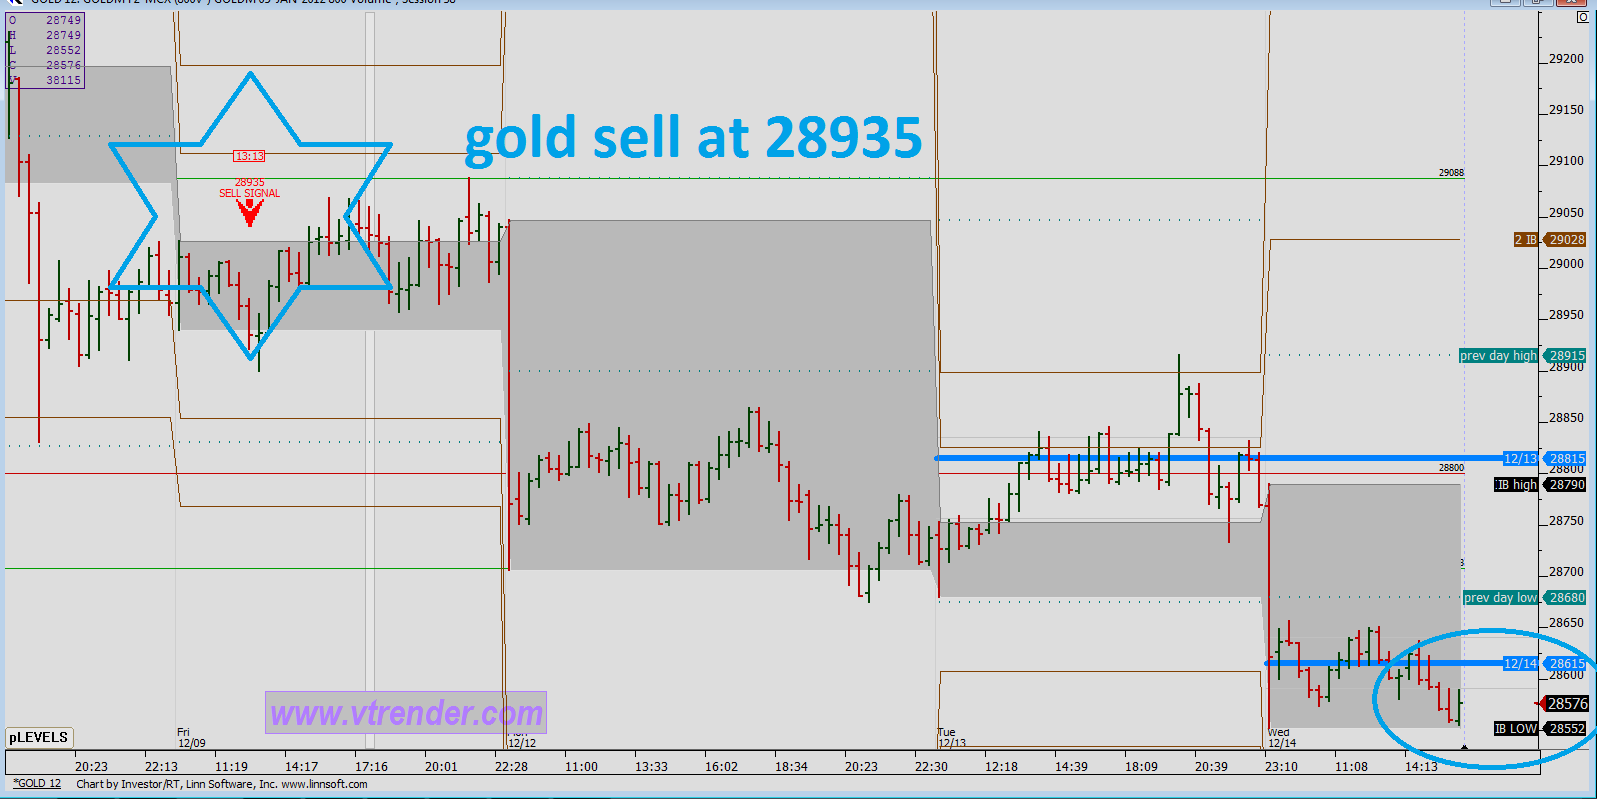
The Orderflow has kept us ahead of the trends.

Here is the updated record.


Thursday, December 15, 2011

Gold Longer Term View

One of our readers, Jigs, sent me these charts on Gold which he tracks closely.

Charts are self explanatory.


Desi MO (McClellan's oscillator for NSE) at EOD 15th DEC 2011


Trend- 15/12/11

Here are the OrderFlow charts of the NF and the BN futures for today.

Nifty :


BankNifty :


The OrderFlow works on Market profile and Nowadays I'm tweeting actively on the markets through my twitter ID.

Market Profile helps me organize my day and puts me abreast of the changes taking place.

Here are some of the tweets from today :


4731/42 are lower ends of 3 day balance zone. After a neutral day possibility of new trend is higher
6 hours ago

down 50 points already from the 4731/42 zone. 4649 is an early tgt
5 hours ago 


day has turned.
4 hours ago 

for the moment we are riding till 4730 with stop at 4690. abv 4735 can give 4756-67

Follow me on http://twitter.com/vtrender

Nifty Trading - An Astro Perspective

RM and Me got interested on a peculiar topic and started researching on this. The data extraction, analysis and everything belongs to Rm. "Yours faithfully" as always, is trying to grab the honors by presenting it. :)
  1. One of the most feared elements for a trader is gaps. The more experienced ones always try to close the position towards End Of Day as a measure of caution. What if there is a news based gap up, what if there is a global sell off based gap down - these worries really haunt the amateur trader. Carrying the position is always a Catch-22 for the prospective trader. We wanted to analyse the problem to the bare bones and shatter or reinforce the myths. :)
  2. We have taken NF data for the last 6 months - from May 2011 till date. It has a total of 155 trading days. Not big - but a reasonable sample. During the period, NF has fallen from 5800 to 4700 - a fall of approximately 1100 points - so it is mostly a bear market phase. Secondly, any gap less than 20 points - we considered it as flat, so as to reduce the noise.
  3. Firstly, please find the datasheet here.
  4. One of the most striking aspects that occur immediately is - out of 155 trading days - there were 38 gap ups, 40 gap downs and 77 flat open days. That is approximately 25% each of gap up and gap downs and 50% flat open days. Well, there are two ways to look at this. Firstly, I can see people saying it is useless to carry a position - because 50% times it does not pay to hold it. Secondly, I can see people who see no harm in carrying a position because it can hurt them only 25% times. ( 50% flat and 25% gap in their direction - do not hurt them. :) ). Take your own call, and trade with conviction.
  5. We tried to zoom it down to one more level - and analysed the gaps in terms of weekdays. Some interesting things came out. 
    1. Firstly, out of 38 gap ups, 20 occurred on a Friday or Monday. So, clearly Weekends are marked for news driven gap ups. Or should we say news is made to order on a weekend? The probability of a Monday gap up increases a lot more when there is a Friday gap up. Further, Monday has the least flat days. So, contrary to the general belief, that it is better to go home empty on a weekend, it pays to hold a position over a weekend - if you get the direction right. The statistic also proves Girish's Statement that "Rallies occur in the night and weekends and Falls Occur in Broad Day light." :)
    2. It does not pay at all to carry a long position on a Wednesday evening. On a Thursday, we have only 3 gap-ups so far and 25 flat to negative days. So, buying a long on a Wednesday evening is strict no - according to this stat. :)
    3. Similarly, Shorting on a Thursday evening does not give any returns. We have only 5 gap downs and 27 flat to positive days. So, staying a short on a Thursday evening does not help much.
    4. 36 of the 77 flat days occurred on Wed and Thursdays. Clearly, carrying positions in the middle of the week does not pay much.
  6. We have added the day trading range as well - and analysed the ranges in terms of weekdays. Some more interesting things came out.
    1. Though Friday opens gap up on most days, it closed flat to negative on 23 out of 32 - approximately 75% of times. So, the concept of profit booking on a Friday is a real thing. :)
    2. Thursday's have the most positive trading range. Though, they open flat to negative on most days, they close down only on 9 out of 28 - 33% of times. So, Thursday buy at open should be generally good.
  7. I am sure you are disappointed. I know you might have come here expecting some analysis on planetary influences and such fancy stuff. I humbly accept that the title is a misnomer. But, in these days of race for attention grabbing - in these days of information over flow - I needed to resort to this to grab your attention.:)
  8. At VTrender, we always look for simplification of trading system. As with Maths and Chess, in trading also the simplest solution is always the best, the most elegant and effective. Hope this analysis helps you in simplifying your trading methods. Please offer your feedback. Ofcourse, feel free to make your own deductions from the data sheet. 

Wednesday, December 14, 2011

Desi MO (McClellan's oscillator for NSE) at EOD 14th DEC 2011


Commodity trend signals

Here are some charts from the commodity space of the 4 indices we track at Vtrender.

These are Gold/ Silver/ Copper and Crude.

Crude : Lot size of 100.


Copper : Lot Size of 1000/-


Gold M : Lot size of 10/-


 SilverM : Lot Size of 5/-.


Monday, December 12, 2011

Desi MO (McClellan's oscillator for NSE) at EOD 12th DEC 2011


13/12/11


Nifty : We had a neutral day on friday and as I have mentioned several times on this blog before, the day following a neutral day tends to become a trend day in a large majority of cases as one party gives way and the other party dominates.

An exit of value and range would have put you on the path to handsome gains in the markets today.

The day was an open drive off the morning's open and the failure of the buyer of friday to stand up again at 4860 as he did on friday resulted in a close at the lower ends of the day or about a 145 points off the open.

There was evidence of large volumes at 4847 gain today, which could be the liquidation of the buyer from friday off 4860.

The profile is irregular with a large distribution at 4810 where the market spend considerable time. We may see this point being visited and tested.

From the composite profile dated 28/11, support comes at 4747 and then the HVN at 4713. Any move higher towards 4840 will be an opportunity to re-sell into the market.Another close below 4783 tomorrow will drive the market to 4660 and then 4536.

BankNifty :


The bank Nifty had an Ir-regular profile and a close at the lows.Large volumes were seen at 8741 and 8616.

Trend- 12/12/11

Overnight and coming into the day's open we were short at the close on Friday.A small whipsaw off the open based on global cues took us out, but we were back into a full position at the same price as Friday.

Nifty :


The trend clearly stayed down below vwap and closed at the lows of the day.

BankNifty :


We follow all the signals from OrderFlow as it captures all the moves of the market.

Here's the performance scorecard from the 7th of November to the 6th of December, a period of great volatility in the markets.


The period returned for us 990 points in the Nifty and 1868 points in the BankNifty.

The Key with any great system is to have discipline. OrderFlow analyses the market for us, and the balance is our job to execute the analysis.

For any person to be successful in trading the simple formula is :


Trader ( you ) x System ( OrderFlow) = Success
 
Remember it is a multiplication sign( not a plus sign)  between you and the system, so without your efforts the system cannot give you any results.
  

The key word here is discipline. Unless you have it, no system will work with you

On another note, I have been more active on Twitter than at any time before.

Follow me on http://twitter.com/#!/Vtrender .

 I'm happy spelling out the auctions of the markets and discussing it's reactions including possible targets and other subtle messages.I'll be also responding to queries if any.

Friday, December 9, 2011

Desi MO (McClellan's oscillator for NSE) at EOD 9th DEC 2011


Long liquidation and a game changer?

For the benefit of our readers here, this was posted after the market close on our subscriber website.


After our close, Mario Draghi changed the course of overseas markets in one telling statement.


Trade carefully!

09/12/11


Coming into the day, we were watching the spike lows at 5064, per this comment from last night

"Today's lower spike was from 5114 to 5064 in a market which stayed above 5100 for the most part. Acceptance below 5058 at the open tom which is the High volume node and below the spike lows would bring an 80% rule trade targeting 5022 and 4986 immediately.Below 4986 can bring gap fill at 4885"

At the close we saw a b shaped profile confirming that the spike which started late afternoon yesterday, was indeed long liquidation!

The value area of a b shaped profile is vitally important and today's value area between 5007-4947 will be important for shorts if they want to continue the offensive.The pull back high was at 5006 just above the high volume prints of 4997 and likely to resist the market up movement tomorrow.


Also of interest to traders would be the weekly value area high which currently stands at 4946. Any move below can still invite an 80% rule trade even though tomorrow is the closing day for the week. Technically the 80% rule weekly trade can work till Monday's first session too.The weekly values are 4946-4824-4751.

We are living in turbulent times with every piece of news, generating huge swings making the market too volatile to call a direction for certain over a period of time. Aggressive traders may look at the above as an opportunity and look for excellent day trading set-ups, though even on a day like today with a clear trend in the morning, it was difficult to be absolutely certain on an entry price. Conservative traders may just choose to stay in cash until all the news flow dies down.

Wednesday, December 7, 2011

Desi MO (McClellan's oscillator for NSE) at EOD 7th DEC 2011


Intra update- 07/12/11

Once again we are seeing the beauty of a neutral day play out in the session following it.

A neutral day has longer time frame buyers and sellers operating who each try to move the market their way. This results in a fair bit of choppiness in Intra day activity . It's the day following the neutral day which is important as one part gets decimated and the other party takes control.We are currently seeing a P shaped profile in the markets induced by short covering as the shorts from the previous session have been forced out. The rest of the day can be consolidation or a new move above IB high if new information enters the market.

In an earlier post, I had commented on the market holding or not holding on to the gains following the big move off the central bank Interventions.Clearly the market has moved higher off the news .and we are seeing a double distribution pattern playing out in the markets.

Here is the chart which was posted on Vtrender- 2 over the holiday.It's a composite profile of the past three sessions following the big gap up.

The chart does not have today's session, but longs are clearly in business above the 5058 volume node seen in the upper distribution. Today's low has been 5055 so far.

Starting today I intend to be a lot more active at my twitter handle https://twitter.com/Vtrender.

I would be posting titbits on market behavior and the auctions taking place during intra hours.

If you have any questions on the markets or on what we do at Vtrender, feel free to chat me up  there

Friday, December 2, 2011

Desi MO (McClellan's oscillator for NSE) at EOD 2nd DEC 2011


Trend- 2/12/11

Here's the signals generated today for the NF and the BN.


Safe and effortless trading,

Keeps you on the right side iof the trend also.

Thursday, December 1, 2011

Desi MO (McClellan's oscillator for NSE) at EOD 1st DEC 2011


Trend 01/12/11


Euro Crisis

At around 4.00 pm IST, the Chinese Central bank lowered reserve requirements.Our Nifty had closed by then and with a Blue OrderFlow ( God bless that analyser), but during the day we had noted several things which spoke about something being amiss in our markets before the close. That move by the Chinese sent the US futures from 1190 to 1208 in about 15 minutes.

Less than an hour later, the US FED increased it's swap lines with foreign central banks majorly from Europe. That sent the futures further up from 1208 to 1228 in about 10 minutes. The rest of the day that market stayed in a 15 point range. Clearly shorts were fried.

This morning the NSE opened around 4978, up 140 points from the close but has remained in a 30 point range since.Again a case of shorts moving out, but can the buyers move in?

Globally we are seeing an effort by central banks to increase liquidity.On the face of it, the reason the shorts moved out was that they recognised that a global concerted effort was another indication that the famed printing presses are moving at full pace and this is another "Stealth QE" for the globe.That's why I keep mentioning that shorting a market is always difficult because any day you can have the full government machinery rolling against you.The government will never come in the way of a soaring bull market.

Anyways we are tracking the Euro crisis at this link here : http://online.wsj.com/article/SB10001424052970204449804577068932199637016.html?mod=e2tw

The recent efforts will mean a possible move to swing highs in the short term.Whilst it's a short term victory earned and a few Lehman's avoided, I have no doubt in my mind that this new liquidity will increase global inflationary pressures which means that we here in India will not get any respite. View that against policy paralysis and India does not look that great a story anymore.

Back to the markets, we are looking for further clues to see if the markets can rise higher. Remember it is not in the news, but the reaction to the news that is important. Tomorrow we will look to see if the market can rise higher.  The weekly bar trend would certainly move upwards.We are also a bit early in the daily cycle and this move should play out till December 6th when the next half cycle low is due.