
Thursday, June 30, 2011
Wednesday, June 29, 2011

Nifty Road Map 29/06/11
Nifty Future chart June Series :

Perspective : With two days to go for the June settlement and global markets pre-occupied with Greece, it will be foolhardy to draw more longer term inferences from current market action.
We will continue to focus on the immediate short term. Our views are valid only for today's session.
BackGround : We spoke about 5558- 5563 as resistance to the day and 5501 as support yesterday. The markets made a high of 5558 and a low of 5491. The low of yesterday was the high from Friday which the market met before strong responsive buying emerged to take the market higher again.
Chart Speak :
1) A balanced profile where value was created in the value zone of Monday.
2) The proper trade set-up would be a break of value or range either side when the market finds balance in a 2 day range or more.
3) The POC at 5540 is important for the day bias today and longs would be safe above it.
4) Resistance will be at 5608 today.
Tuesday, June 28, 2011

Monday, June 27, 2011
Nifty Road Map 28/06/11

Here's a profile chart of the Nifty action of today.
We see :
- A strong open drive from 5444 to 5512
- A p shaped profile pointing to short covering in the market
- Minor selling at 5558
For tomorrow :
- Immediate support will be at 5501
- Resistance at 5558-5564
- Above 5564, NF can do 5594

Saturday, June 25, 2011

Friday, June 24, 2011
Order Flow 1.2
Nifty :
A buy at the open is always an indication of new determined players entering the market.

The market has visited the old support point at 5437, now resistance.
Bank Nifty :

Our BankNifty buy has given over 350 points so far.
We note an aggressive seller at 10835 region who has been driving the market down.
Thursday, June 23, 2011


Tuesday, June 21, 2011

Updated OF at close of session
The market reversed after my last post at 1.30, as we saw OrderFlow charts print sell signals in RIL, ICICI, SBI, NF and BN simultaneously
Here is the updated chart for the NF and the BN for today.

The Bank Nifty met with resistance at day PR1.

OF then confirmed an easy short to day PP0.
Here is the updated chart for the NF and the BN for today.

The Bank Nifty met with resistance at day PR1.

OF then confirmed an easy short to day PP0.
OrderFlow from Today & yesterday
The volatility of yesterday did give us a small blip but once again proved the amazing versatility of our indicators.
The NF sell was generated at 5365 with a buy back at 5258

Bn has been a buy since 10536 yesterday with a high reached of 10679 today by 1.30 today.

The NF sell was generated at 5365 with a buy back at 5258

Bn has been a buy since 10536 yesterday with a high reached of 10679 today by 1.30 today.

Monday, June 20, 2011

Saturday, June 18, 2011

Friday, June 17, 2011
LT Profile
Here is a profile chart of LT with the chart on the extreme right being today's unfinished profile

LT has found support this morning at the HVN of 1673.
We have onserved an inablity of LT futures to break above 1740 and is currently at the lower end of it's bracket.
The chart is annotated and self-explanatory
A move below 1673 will bring 1632 in LT now.

LT has found support this morning at the HVN of 1673.
We have onserved an inablity of LT futures to break above 1740 and is currently at the lower end of it's bracket.
The chart is annotated and self-explanatory
A move below 1673 will bring 1632 in LT now.
Thursday, June 16, 2011

Wednesday, June 15, 2011

Failed auction revisted.
Monday's lows of 5437 which we had described as a failed auction in this post here and called for a revisit this week based on the Market profile " Failed Auction theory" was done today
In fact the lows of the day were the failed auction point of 5437/ 38.
As with other concepts of Market profile, this theory has an amazing success rate and one can easily play 2 way moves of a min 70 points in both directions once the set-up is spotted.
Here are the order Flow charts of the morning, which confirm what profile told us in the morning, the presence of a strong seller off the open :
Nifty :

We do not account for the signals which come in last 10 mins of trade as they are due to intra day profit booking/ short covering.
The OF was red throughout the day
Bank Nifty :

Profile charts also showed the presence of a strong seller at 10835 levels, who took the market to Monday lows.
ICICI :

The poor lows at 1032 from 13/6 were revisted
SBI :

A clear rejection of yesterday's normal distribution in SBi took the market lower today
Tuesday, June 14, 2011

Monday, June 13, 2011

Order Flow & the Power Levels
Sometimes the sellers are so dominant that the signals generated by order flow confirm over a larger period.
SBI is a good example :

The sell signal from 2315 was valid till 2245 today.The market hit today's PS1 at 2222 and rebounded.
A slight whipsaw as the market tried to move above PP0 today.
The PP0 level comes from our judicious use of Market profile volumes.The trend of the day is weak below PP0 and strong above it.
The levels of PS1, PS2, PS3 are levels to book shorts and PR1, PR2, PR3 are levels to book longs.
The orderflow for BN confirms the buy above PP0 at 10661 today.

NF OrderFlow
This morning, we had an orderflow which asked us to reverse overnight longs at 5462 in Futures, something which we did and booked profits at PS1 which wasa pre market level generated through market profile charts.

Subsequently we got a long signal at day PP0 level of 5562, a a position which is up 50 points already!
We also looking at a failed auction in the Nifty Futures. You can learn more about failed auctions here
The market may visit 5437 again this week in a 75 % probability scenario based on previous results, but if it doesn't then we will have a long term move on our hands, the roots of which we may have seen already.
Nifty Next week
2 weeks back when we did a study on the Nifty for the medium term trend, we had emphasized the importance of the 5550 levels on a closing basis for the weekly trend to move up . On the daily we had capped the volatility to stay below 5623 levels based on the profile charts we have been observing.
As we begin the next week, the indices are at levels where they were about two weeks back. With world markets turning volatile, monetary policy announcements and the intermediate term time-cycle and the daily cycle approaching their ends, we may get a decisive move away from the range sometime during the middle-to end of this week.
Let's look at the charts to see where the move can emerge.

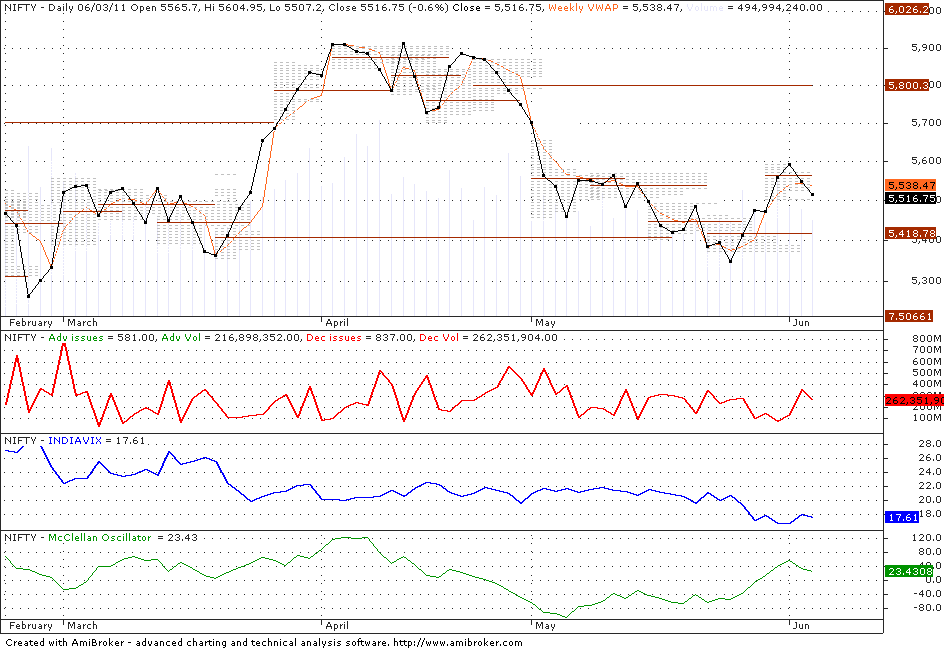
In the past ten sessions, the profile has clearly gone sideways, with value being created between 5490 and 5570.Friday's close was at the developing point of control at 5488 and the lower boundary of the value area mentioned above. What stands out in the profile is the single prints from 5436 to 5416 which the institutions would try to defend in the early part of this week. A failure here can easily set the index to 5350 levels.
Let's also look at volume profile charts to see where the volumes have occurred over the past thirty days.

There are two composite profiles in the chart- one for a five day period and the other for the 30 day period.Both of them show high volumes at 5535/ 5550 which if overcome on the upside may result in some short covering in the markets.
On the whole, the week promises to be volatile as the market should be testing some known reference points again.
Trade safe.
As we begin the next week, the indices are at levels where they were about two weeks back. With world markets turning volatile, monetary policy announcements and the intermediate term time-cycle and the daily cycle approaching their ends, we may get a decisive move away from the range sometime during the middle-to end of this week.
Let's look at the charts to see where the move can emerge.

In the past ten sessions, the profile has clearly gone sideways, with value being created between 5490 and 5570.Friday's close was at the developing point of control at 5488 and the lower boundary of the value area mentioned above. What stands out in the profile is the single prints from 5436 to 5416 which the institutions would try to defend in the early part of this week. A failure here can easily set the index to 5350 levels.
Let's also look at volume profile charts to see where the volumes have occurred over the past thirty days.

There are two composite profiles in the chart- one for a five day period and the other for the 30 day period.Both of them show high volumes at 5535/ 5550 which if overcome on the upside may result in some short covering in the markets.
On the whole, the week promises to be volatile as the market should be testing some known reference points again.
Trade safe.
Saturday, June 11, 2011

Friday, June 10, 2011
OrderFlow from Today
A quite day turned volatile into the close
Most of the session showed the complete absence of buyers in propping up a dull market and the market continued to drift lower before some aggressive shorting and covering late into the day, brought some excitement to the day's proceedings.
Here are the OrderFlow charts for Nifty :

Sellers were in control since morning as OF was red all through Shorts started covering at day PS3.
BankNifty :

OrderFlow shorts triggered at 10750. Shorts covered near day PS3.
ICICI :

Shorts again covered near day PS3.
Thursday, June 9, 2011

Order Flow forTata Motors
here is an Updated chart of tata motors since yesterday

Notice the signal reversal at 1039 telling us that sellers had come into the market again.
Current lows in tata motors are 1007
Watch :
PS2- 1005
PS3- 991.
PS2 functions as a bigger support for the market and works opposite to PR3

Notice the signal reversal at 1039 telling us that sellers had come into the market again.
Current lows in tata motors are 1007
Watch :
PS2- 1005
PS3- 991.
PS2 functions as a bigger support for the market and works opposite to PR3
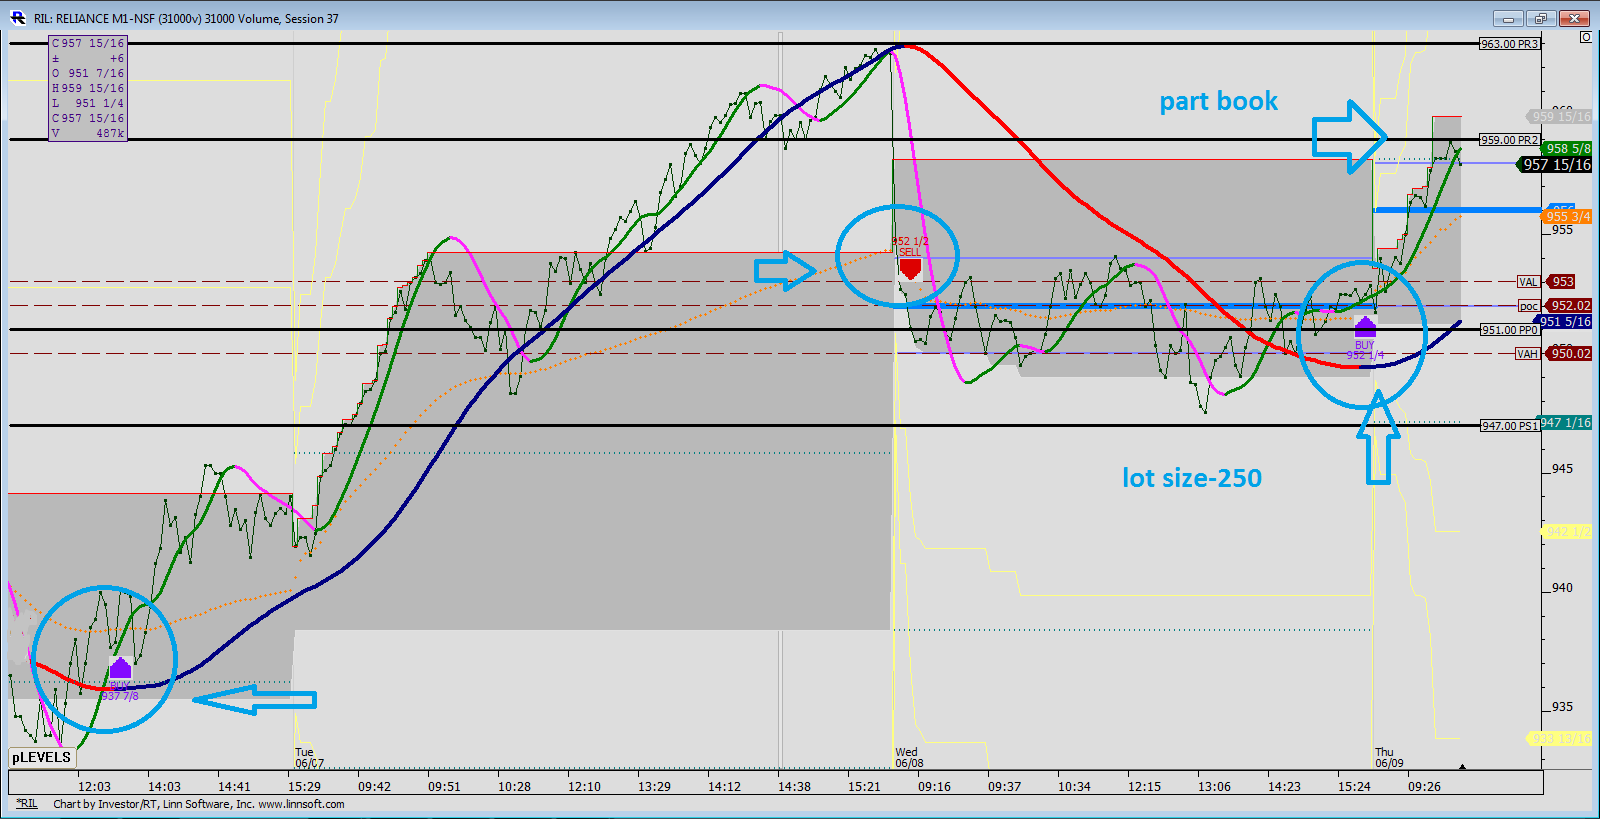
Order Flow for Reliance
Reliance is making another attempt at the high volume node of 964.
Buyers are in control this morning, as OF has been in buy mode.

Watch :
PR2 at 959
PR3 at 963.
A close above PR3 it's a carry
Buyers are in control this morning, as OF has been in buy mode.
Watch :
PR2 at 959
PR3 at 963.
A close above PR3 it's a carry
Wednesday, June 8, 2011

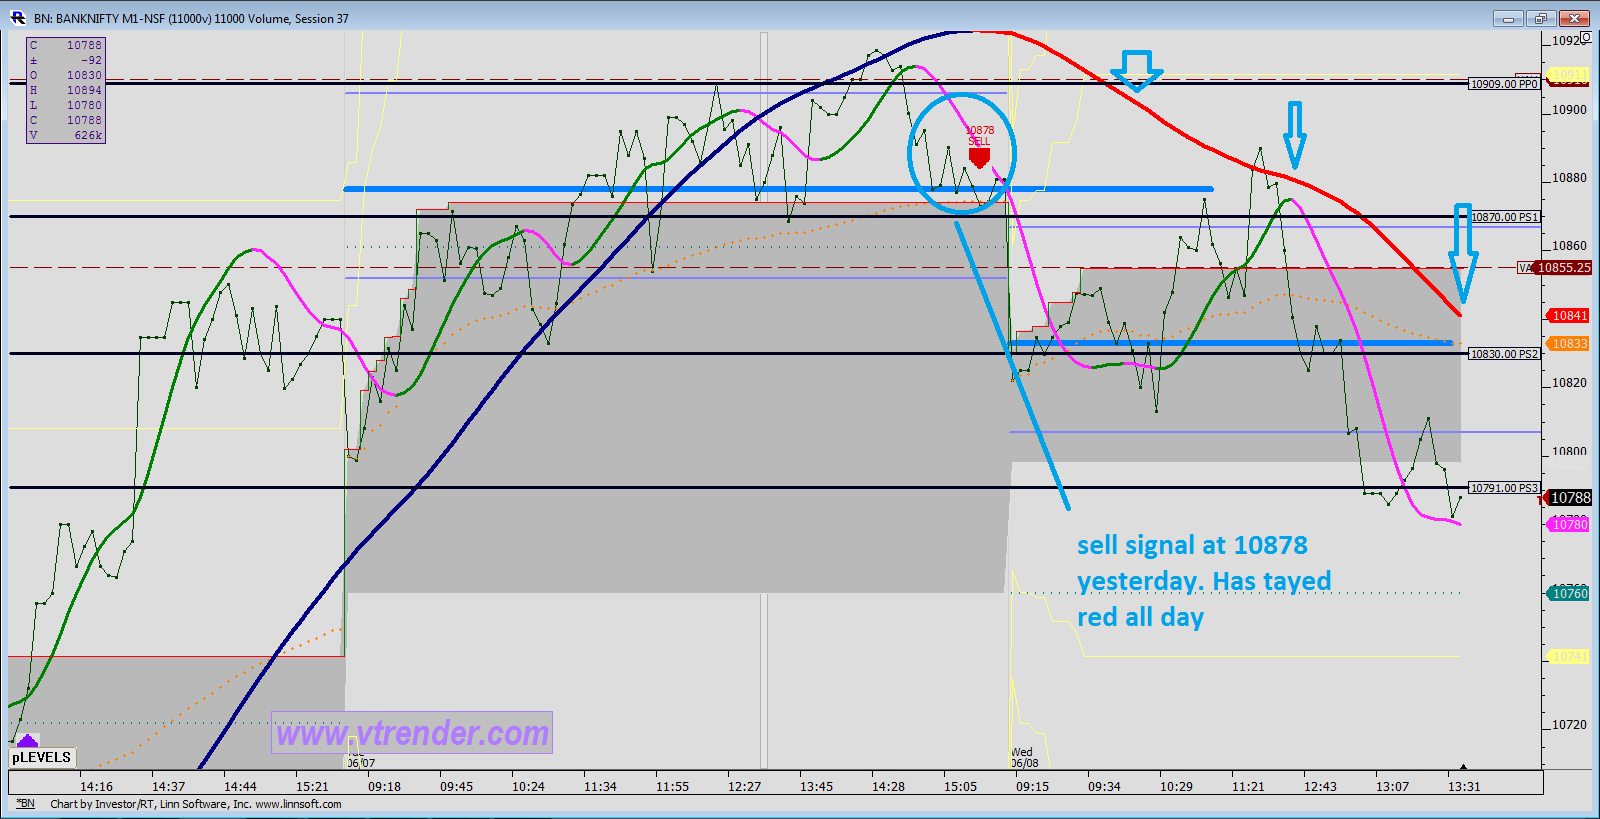
Order Flow for BankNifty
Yesterday in the BN intra day update we spoke about exiting longs at 10917 in BankNifty and waiting to see if OrderFlow confirmed our pre-market assessment.

We got a sell signal in the last few minutes of trade in the BN, a signal which stayed red all morning today confirming that sellers were in intra-day control for the moment. At the time of this post, the BN is down over 100 points from that signal and 10750 and 10790 are points to take some of the profits off.
We got a sell signal in the last few minutes of trade in the BN, a signal which stayed red all morning today confirming that sellers were in intra-day control for the moment. At the time of this post, the BN is down over 100 points from that signal and 10750 and 10790 are points to take some of the profits off.
Order Flow for Tata Motors
Tata Motors-

Pre market levels on Tata Motors
PR3- 1055
PR2- 1048
PR1- 1041
PP0- 1034

Pre market levels on Tata Motors
PR3- 1055
PR2- 1048
PR1- 1041
PP0- 1034
Tuesday, June 7, 2011

New OrderFlow
In our trading room we have introduced signals for our orderflow indicators as well as levels to decide part booking or exiting an established position.
Check the buy call in BN at 10712 yesterday

Based on our intra day "power levels" we have set alerts to exit the holding at 10917 or 10994 BNF based on the message coming from orderflow at that time.
Check the buy call in BN at 10712 yesterday

Based on our intra day "power levels" we have set alerts to exit the holding at 10917 or 10994 BNF based on the message coming from orderflow at that time.
Monday, June 6, 2011

Pre market check
At Vtrender -2 we do a comprehensive pre market update on the Nifty, BankNifty , Reliance, SBI and ICICI for a bias to the morning session as well as levels to book profits or initiate new ones.
The pre market levels can be confirmed with the Order Flow charts in the trading room.Here is a small preview (without the charts)
Heading into the open, we had the following out :
NF :
- A DD day with 2 distributions between 5556- 5608 and 5510-5540
- the weak structure from 31/ 5 has been addressed
- if market auctions below 5499, it can hit 5476/ 5464 (HVN)
BN :
- A dd in BN with distribution between 10720-10790 and 10845-10945
- Below 10690 it can see 10652 and 10610 below that
SBI :
- SBi also ad a DD day
- 2326-2306 and 2340 and 2364 represent the two auctions of friday
- below 2305 it can see 2285/ 80 and 2265
RIL :
- Another DD
- 951-939 and 957-969 represent the 2 auctions
- 930 is support below which it can see 917
ICICI :
- ICICI had poor structure and imbalance for friday's move
- below 1048, it can slide to 1036
Updates at 11.30 am :
- NF low- 5475
- BN Low -10650
- SBI Low- 2281
- RIL Low- 932
- ICICI Low- 1040
Saturday, June 4, 2011
Thursday, June 2, 2011

Wednesday, June 1, 2011

Subscribe to:
Posts (Atom)

