
Sunday, July 31, 2011
Saturday, July 30, 2011
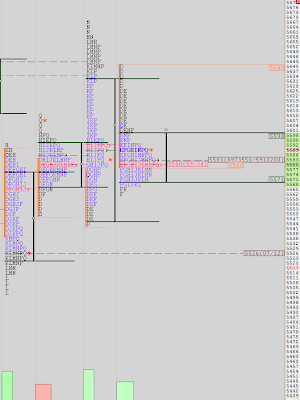
MCX Copper and Gold
Here is the OrderFlow chart of Copper :

1 point equals 1000/-
Gold :

1 point equals 100/-

1 point equals 1000/-
Gold :

1 point equals 100/-

Friday, July 29, 2011
Nifty Road Map 29/07/2011
Nifty Future chart August Series :

Perspective : A new series opens on the backdrop of selling based on the RBI event and uncertainty over the debt issues from the world's largest economy.The larger time frame may still be on the sidelines, waiting for an opportunity to enter or exit.
Back Ground :- The down auction from 57xx levels has already shaved off 250 points in the index in 3 days to create an imbalance in the market. The markets showed a return to balance by putting on a bell shaped profile yesterday.The move out of this bell shape is the new auction.
Chart Speak :
- A bell shaped curve.
- a Prominent point of control at 5502 with high odds of being visited.
- Bias below 5503 is negative today.
- 5459 is PS2 and 5437 is PS3.
- Upper resistance at 5525 which is PR1.
The above post is for purpose of education only. Similar charts are posted for the BN, LT, RIL, ICICI, SBIN everyday on our premium website http://www.vtrender-2.com
Thursday, July 28, 2011

Wednesday, July 27, 2011

Nifty July performance
As we close out the July series tomorrow, here's a look at what traders did during the series and the values which developed.
Nifty July :

The chart shows that through the series the region of 5570 evoked the maximum interest amongst traders this July and maximum volumes were exchanged there.
This makes 5570 the fairest value for price or the region which holds max value for traders.In an ideal scenario the expiry should happen at this price or near this price.The upper level is represented by a VWAP at 5617. This region and above represents the point at which the expiry should not happen.Generally a Point of control below vwap means a seller dominated through the series and the expiry should favor the seller.
Bank Nifty July :

Whilst looking at the BN monthly profile we see price stretched or too far removed from profile lows or value. This means that the current lot of sellers in BN are not enjoying great value and the market can easily do a short covering number on them.
Value low is at 11176 whereas the best price for the series was at 11250 which is where the vwap and the point of control converge.
The most probable scenario would be for price to migrate closer to the best value tomorrow.
OrderFlow Gold.
Here is an OrderFlow chart of Gold Futures traded on the MCX for the Intra day trader.


Nifty Road Map 27/07/2011
Nifty Future chart July Series :

Perspective : Yesterday's news based selling can be construed as an emotional reaction of the markets to anticipation. In such cases, it is better to react to the market's present situation on a more longer term time frame.
Back Ground :- After cutting short positions on Monday and Friday,yesterday's slice through the value area show a rejection of that zone and those higher prices. The value area of Monday was covered in single prints, as traders took the market back in the previous bracket
Chart Speak :
- We are back in the previous bracket of 5675-5536
- Expiry pressures and news from overseas markets continue to make this an emotional trading environment.
- Most of yesterday's distribution seen between 5616 and 5562, again showing the market's likeness to the previous bracket.
- As long as 5548 holds, recovery efforts will be seen.
- Minor strength above 5589 towards 5610/ 5630.
- A close above 5605 can put the market back up to 5675.
The above post is for purpose of education only. Similar charts are posted for the BN, LT, RIL, ICICI, TTM, SBIN everyday on our premium website http://www.vtrender-2.com
Tuesday, July 26, 2011

Orderflow BN
Here is the OrderFlow chart of the BankNifty today.
The BN was the focus of traders today as it contains a lot of rate sensitive instruments, which would give important cues to market behavior ahead and after the announcement from the RBI governor.

What was interesting to note was the sell signal generated 2 mins ahead of the announcement as smart5 money started liquidating positions built since Friday.
The trade returned a handsome 255 points, once again establishing the BN as a premier OF indicator. Our records put the success percentage at over 91 % for the Bank Nifty with each gain measuring over 70 points.
What's important to also note is the PP0 which was not encouraging for longs off the open. I've said it before that a market is short below PP0 and long above it. It is an excellent stop n reverse level for the day.
Today's fall puts the two markets back into the balance zone where NF 5535-5550 is the lower support. The huge volumes may be traders adjusting inventory which had gotten too long ahead of the announcement.Tomorrow is a 3 I concept day.
Nifty Road Map 26/07/2011
Nifty Future chart July Series :

Perspective : The first part of today's session will be quite (or anticipatory) ahead of the RBI policy announcement.Regardless of what the policy says, It's the market's reaction to it which is supreme.The market has climbed 150 points in two days, anticipating an early end to the rate hike policy.Anything otherwise can send the market back into the bracket.
Back Ground :- The P shaped profile witnessed first on Friday played out fully today as traders cut their short positions.This market would now require buyers to step in to take the market higher.
Chart Speak :
- A double distribution ( DD) which is incomplete in the upper half.
- We treat a DD day as two separate auctions, with the next session to confirm the price move.
- A Minor buying tail at 5616 near the value area low of the previous day.
- 5661 divides the two auctions and price acceptance above 5661 will keep the bullish momentum intact.
- Resistance at 5730. PR 3 for the day is 5775.
The above post is for purpose of education only. Similar charts are posted for the BN, LT, RIL, ICICI, TTM, SBIN everyday on our premium website http://www.vtrender-2.com
Monday, July 25, 2011

Vtrender 1-2-3 offer
At Vtrender Live you can get :
a) Live Streaming charts on 4 major instruments which include Nifty, Bank Nifty, LT, RIL, SBIN, and RIL futures. We have added copper MCX and Gold MCX to our product mix and we will soon have crude oil and silver futures as well.
b) Order Flow indicators and buy/ sell signals on charts. Our Order Flow indicators have returned an accuracy level of 91.3 % in the Bank Nifty and 71.3 % in the Nifty. More importantly it has kept the losses small.
c) EOD analysis on all major instruments and the broader market
d) Live audio session to project views as well as answer questions
e) Trading room with a 1 on 1 interface for all queries regarding trades and set-ups.Trading room is now open from 9.00 am to 11.30 pm.
f) Community support and views of other traders.
Vtrender Live 1-2-3 Offer.
a) Get 1 month free on our regular quarterly plan of INR 9999/-, now valid for 4 months instead of 3.
b) Get 2 months free on our regular half yearly plan of INR 17999/-, now valid for 7 months instead of 6.
c) Get 3 months free on our regular annual plan of INR 29999/-, now valid for 15 months instead of 12.
This offer is valid only till settlement day on Thursday 28th July as we begin a new series from Friday.Existing subscribers can choose to upgrade to any of the plans above, which will be effective once your current subscription runs out.
Those of you who want to try out the monthly plan can avail a 10 % discount on the same. The cost would be INR 3599/- until 7th August.
You can subscribe using Paypal as a link to your right or by clicking here for Inter Bank transfer.
a) Live Streaming charts on 4 major instruments which include Nifty, Bank Nifty, LT, RIL, SBIN, and RIL futures. We have added copper MCX and Gold MCX to our product mix and we will soon have crude oil and silver futures as well.
b) Order Flow indicators and buy/ sell signals on charts. Our Order Flow indicators have returned an accuracy level of 91.3 % in the Bank Nifty and 71.3 % in the Nifty. More importantly it has kept the losses small.
c) EOD analysis on all major instruments and the broader market
d) Live audio session to project views as well as answer questions
e) Trading room with a 1 on 1 interface for all queries regarding trades and set-ups.Trading room is now open from 9.00 am to 11.30 pm.
f) Community support and views of other traders.
Vtrender Live 1-2-3 Offer.
a) Get 1 month free on our regular quarterly plan of INR 9999/-, now valid for 4 months instead of
b) Get 2 months free on our regular half yearly plan of INR 17999/-, now valid for 7 months instead of
c) Get 3 months free on our regular annual plan of INR 29999/-, now valid for 15 months instead of
This offer is valid only till settlement day on Thursday 28th July as we begin a new series from Friday.Existing subscribers can choose to upgrade to any of the plans above, which will be effective once your current subscription runs out.
Those of you who want to try out the monthly plan can avail a 10 % discount on the same. The cost would be INR 3599/- until 7th August.
You can subscribe using Paypal as a link to your right or by clicking here for Inter Bank transfer.
Nifty Road Map 25/07/2011
Nifty Future chart July Series :

Perspective : A sideways trading range, called a bracket in Market profile is best traded through short and sharp moves whilst being aware of the potential of the market to stage a breakout at the extremes.
Back Ground :- A sideways movement as evidenced by a side-on Point of control (POC). Bracket extremes defined clearly in chart above.
Chart Speak :
- The open on Friday at Thursday's range highs tested the Point of control and moved sharply higher.
- A P shaped profile ( structure of Friday resembles letter P ) indicates that the market moved up on short covering, not a barometer for internal strength.
- Value areas defined at 5649-5619
- Minor strength can be seen above 5654 which can bring 5678 and then 5701.
- support below is at 5583.
The above post is for purpose of education only. Similar charts are posted for the BN, LT, RIL, ICICI, TTM, SBIN everyday on our premium website http://www.vtrender-2.com
Sunday, July 24, 2011


Saturday, July 23, 2011
Price n Time
One of the better things we as profilers enjoy to do is to see the changing dynamics of the market relative to time.
In market profile, we get an excellent read on the market when we see Time on the Horizontal axis instead of price.In fact No study of the market is complete without understanding the movements of Price, Volume and Time.
At Vtrender we form our biases by looking at the intermediate time frame for the trend and understanding the role the smallest time frame player- the day time frame, plays with respect to that. We prefer to look at moves within a 3 month cycle- a preferred period of the NSE which operates contracts in a 90 day period.
The market becomes very easy to understand if you look at it from that time frame.
Here is a chart which shows Time Cycles for the Nifty Spot over the intermediate term.

The IT cycle for each instrument is different and is comprised of daily and monthly cycles. Each Intermediate Term ( IT ) Time cycle lasts on an average of 84- 99 Calendar days. The approximate duration for a half daily cycle is 15 days. Most people call the daily cycle of the market a Lunar cycle and it is not surprising to see Traders look at New Moons and Full Moons to get a bias from the market.At the risk of alienating such readers, the actual reason which moves the markets is the daily cycle lows and highs.
In the chart above, the blue rectangles represent IT cycles. Each box has the nos of days at the top and the range of the market during that time. The days are depicted as actual sessions, hence you would get numbers from 65- 74 in place of calendar days.
The time cycles are more useful to measure bottoms of the market than tops.
A right translated cycle is the one where a top is formed to the right of the center of the IT cycle.This is an extremely bullish event and can lead to a parabolic rise in the markets.The third rectangle from the left is an example of a Right translated cycle.
A left Translated cycle on the other hand has a top to the left of center and can lead to a sharp move lower.We had a left translated cycle in the month of January this year.The translated cycles can be easily spotted through failed daily cycles.
The last intermediate term low was at 5182 spot on June 20th.We are near the end of the first daily cycle with a daily cycle high and low already in place.The current daily cycle should be over in the coming week.
The projection for the current IT cycle would put a high in the 5950-6000 zone in the next two months.This is considering that we have not topped out already at 5730. If the top is in place, then the market should swiftly move below 5444 in the first 15 days of the next daily cycle.However if recent highs are taken out in the next half cycle then we should easily see 59xx levels before September end. More Importantly the bigger picture would turn bullish for the next IT cycle due between October to January.

Friday, July 22, 2011
Gold OrderFlow
Here is an updated profile chart to the one which was posted yesterday

The market has remained sideways and 22800 and 23175 continue to be short term reference points.
A strong bull market consolidates rather than corrects after a big run up. We may be witnessing that consolidation now. I still maintain that 30 % upside I spoke about earlier this month, 10 of which have already been done!
OrderFlow :

Nifty Road Map 22/07/2011
Nifty Future chart July Series :

Perspective : This market is clearly balancing with short volatile move in either direction failing to resolve the impasse.
Back Ground :- A sideways movement as evidenced by a side-on Point of control (POC)
Chart Speak :
- Yesterday, we started the day on a 3 I concept which gives high odds for the market to make important lows in the first hour of the day.
- The market made it's lows in the first 15 minutes before a rally in the first half which was met by selling pressure at higher levels.
- On global cues, the market is expected to gap up. We consider a gap to be an open outside the previous day's range. It is important to see the market's reaction to the gap( if one happens). You can read about gaps here
- 5607 separates the two distributions seen on 20/ 7 where heavy selling volumes had occurred.
- 5618 is PR3 for the day and prime resistance.
The above post is for purpose of education only. Similar charts are posted for the BN, LT, RIL, ICICI, TTM, SBIN everyday on our premium website http://www.vtrender-2.com
Thursday, July 21, 2011

Gold Intra
Here is a profile chart showing Gold traded on the MCX at current price at 4.30 IST.

Back on July 9th, I had spoken about multi month lows being put in Gold and a profile chart which projected moves to new highs for the year ( already done)
The intra chart posted above projects strength now above 23170 which should easily put 23220 within reach immediately.
Over the weekend I'll put up a bigger intermediate term chart, which clearly shows that this is the biggest bull market across popular instruments traded currently
Wednesday, July 20, 2011

Orderflow BN
Here is the OrderFlow chart of BN for the past 2 days.

We use this mechanical trading system in line with the analysis and the knowledge we have from Market profile.The OrderFlow is a conservative estimate of the buying and selling power of the market intra day, with a red denoting sellers in control.Once a signal is generated it needs to be part- booked at the closest PS1/ PS2/ PS 3 if short or PR1/ PR 2/ PR 3 if long.
Along with these signals, today's trade was an easy 80 % rule trade day which went on to hit it's objective at VAL in both the Nifty as well as the Bank Nifty.You can read about the 80 % rule trade in this post here. With an 80 % success ratio this rule cannot be overlooked.
A third point which I wanted to point out was the inability of the market to stay above PP0 in the first hour of trade. The PP0 represents a redefined value point for the day, with a market staying above PP0 being positive and a market below PP0 to be red.
Here is a 60 min intra day chart for the past 2 weeks which explains the importance of the PP0. Profits are to be booked at ps1/ ps2/ ps3 or pr1/ pr2/ pr3.

Tuesday, July 19, 2011

Nifty Road Map 19/07/2011
Nifty Future chart July Series :

Perspective : This market is clearly balancing with short volatile moves last week in either direction failing to resolve the impasse.
Back Ground :- Larger bracket is seen between 5511 and 5675 with 5593 as the pivot for the week on closing basis.
Chart Speak :
- A normal distribution mostly within the value area of friday
- The lower volumes and lack of participation made it an "inside day"
- On an inside day we trade a break of value and range, as we wait for information that new activity wants to come and move the markets from current value.
- 5594 continues to be our reference point to the upside.
- 5547 would be watched on the downside.
The above post is for purpose of education only. Similar charts are posted for the BN, LT, RIL, ICICI, TTM, SBIN everyday on our premium website http://www.vtrender-2.com
Monday, July 18, 2011

Nifty Road Map 18/07/2011
Nifty Future chart July Series :
Perspective : This market is clearly balancing with short volatile moves last week in either direction failing to resolve the impasse.
Back Ground :On Friday, we spoke about "5584-90 zone as a pivot for the day's trading around which a move to 5636 or 5547/ 5531 can take place" The first part of the move was over within the first few minutes of trade. We continue to see 5593 as an important pivot for this week.
Chart Speak :
- A b shaped profile, with a larger part of the auction below the previous day's POC.
- Day's value area 5598-5571 is important for new moves.
- Larger bracket is seen between 5511 and 5675 with 5593 as the pivot for the week.
The above post is for purpose of education only. Similar charts are posted for the BN, LT, RIL, ICICI, TTM, SBIN everyday on our premium website http://www.vtrender-2.com
Saturday, July 16, 2011

Friday, July 15, 2011
Profile charts for 15th July
Nifty Future chart July Series :

Perspective : After the sell-off yesterday afternoon, most traders were scrambling to check the wires and the channels for news which had caused the slide to happen. That's the kind of effect news driven environments have on traders and we are in one right now, so traders should not let go off their guard.
On another note, the warning from S&P and Moody's on US debt needs to be taken with a pinch of salt, as these same agencies had declared mortgage based securities AAA before the credit crisis began. Overall it leaves me wondering whether they are just leaving the dour open for the FED to unofficially do another QE3 as the US fed will have to buy all debt finally, junk or otherwise.Incidentally the buying program has been going on for almost two years now.
Back Ground : We spoke about 5550 to support the market and " above 5621, 5645 and 5668 can be done". The highs of the day were at 5667.
Chart Speak :
- A 3 I day which gave up all gains at the close, something expected from the market the following session.
- a Large value area would mean a consolidating kind of day
- we see 5584-90 zone as a pivot for the day's trading around which a move to 5636 or 5547/ 5531 can take place.
- larger bullish move can happen over 5636 to take the market to 5688.
The above post is for purpose of education only. Similar charts are posted for the BN, LT, RIL, ICICI, TTM, SBIN everyday on our premium website http://www.vtrender-2.com
Thursday, July 14, 2011

Nifty OrderFlow for today
Attached is the Order flow chart for the Nifty July future.

The big volatile day of today was caught by the Orderflow which gave us a sell at the open, a buy at 11.04 when the Nifty was at 5576 and a sell again at 2.48 pm when the Nifty was at 5646.
We have also introduced Prime levels on the charts which tell us to book an existing position. Thus a long position has to be booked near PR1/ PR2 or PR3. Conversely a short has to be booked near PS1/ PS2/ PS3.The days highs were at PR3 and the lows near PS2.
These levels are derived from the PP0 level which is Prime Point Zero or a neutral point for the day. A market's bias is negative below PP0 and positive above it.
The prime levels are a better way to interpret the market action just like the Pivot point system, but unlike the pivots which run on price only, the prime levels operate on price and volume and are better indicators to day action.
Nifty Road Map 14/07/2011
Nifty Future chart July Series :

Perspective : A news dominated trading environment continues, with the latest news coming out of the Mumbai terror blasts bound to affect the opening prints. Yesterday's China data was the talking point for the news channels, after Italy's debt problems the day before.Overall a difficult terrain to trade, sentiment wise.
Back Ground : We spoke about a positive movement above 5564 and a gap fill in yesterday's post. The index stayed above 5564 all day and even a late afternoon sell-off was met by aggressive buying at 5564 which took the market to day highs and closed the gap.
Chart Speak :
- A spike into the close at 5610 which was gap fill and day/ spike high
- In a spike acceptance above spike high is bullish
- buying prints from 5550-5560 are support for today's market.
- above 5621, 5645 and 5668 can be done.
The above post is for purpose of education only. Similar charts are posted for the BN, LT, RIL, ICICI, TTM, SBIN everyday on our premium website http://www.vtrender-2.com
Wednesday, July 13, 2011

Nifty Road Map 13/07/2011
Nifty Future chart July Series :

Perspective : The market is resting on the outermost boundary of it's lower support.These are not normal conditions to trade as external factors are influencing a lot of the market activity.One needs to be quick to respond to the various cues the market is putting out. Our pre-market updates have worked for the morning session in the past 2-3 days.One should evaluate achieved objectives before taking a trading call.
Back Ground : We spoke about a gap fill attempt by the market near the support of 5546-5551 pointed out in the morning. Holding 5551 at the open, the market tried to fill the gap, but failed by 14 points and created a failed auction signal in the process. Later on in the afternoon, support gave way and the market moved 40 points lower.
The low volume zone pointed between 5596- 5560 was "auctioned into" by the market with the highs being 5593 for the day.
Chart Speak :
- a failed auction signal at 5593
- 2 prominent distributions, one at 5526 and the other at 5564
- small buying prints at 5502-5514
- below 5519, support is at 5485.
The above post is for purpose of education only. Similar charts are posted for the BN, LT, RIL, ICICI, TTM, SBIN everyday on our premium website http://www.vtrender-2.com
Tuesday, July 12, 2011

Nifty Road Map 12/07/2011
Nifty Future chart July Series :

Perspective : The overnight sell-off in global markets based on Italy and a suspect Spain sovereign debt default, should call for a weaker open and a large gap down.
A gap is considered as non-visible single prints. In a gap open, it is important to wait and see the cash market's open to the new levels. A failure to fill the gap can pressurize exiting positions wheres a filling of the gap shows the new activity to be suspect or less strong. The gap down held this morning will pressurize recent longs whereas filling will indicate there are no new sellers.
Back Ground : We spoke about 5640 and 5607 in our weekend post, both of which were hit in yesterday's market. This market has now new information and we have to moiitor the response based on this new information.
Chart Speak :
- 5546-5551 is likely support.
- low volumes between 5596- 5560 on the previous rise can be the market's focus today.
The above post is for purpose of education only. Similar charts are posted for the BN, LT, RIL, ICICI, TTM, SBIN everyday on our premium website http://www.vtrender-2.com
Monday, July 11, 2011

Nifty Road Map 11/07/2011
Nifty Future chart July Series :

Perspective : A normal distribution on Friday created a spike into the close, as the market failed to hold the 5702 level.Acceptance below the spike lows is a bearish continuation
Back Ground : A conventional 3 I day market profile asserted itself as a strong seller showed at the open. We mentioned 5702 as support, which broke down after a rally from that point of about 40 points earlier in the day.The result was that the market closed at it's lows.
Chart Speak :
- open drive down on a 3 I day ( O on top of d)
- larger distribution in the zone of the single prints of yesterday
- spike into the close from 5700-5658
- acceptance below the spike lows on Monday is bearish
- support is at 5638, the base of the previous single print buying
- auction zone can be between 5640-5673 or 5673-5705.
The above post is for purpose of education only. Similar charts are posted for the BN, LT, RIL, ICICI, TTM, SBIN everyday on our premium website http://www.vtrender-2.com
Saturday, July 9, 2011
Stocks, Dollar and Gold.
Stocks :
Those who have been following our daily market posts before the market open, would have noticed the emphasis on the 4 day balanced profile we were talking all through last week. Since this is a weekly update, it gives a chance to project a slightly longer term picture than the intra day analysis we do everyday.
Have a look :

The profile on the left is a composite profile which is in a shape of a bell kept sideways. This always denotes a market in balance and ready for a move out. Such moves generally happen or start from the point of control (POC) of the balanced profile, something we saw early on Thursday morning.We did see a sell off from the open on Friday and a failure to hold the 5702 level marked as support in our friday's post, brought the market down a further 40 points.
But overall we are seeing value developed higher , which is a sign that the sell off on Friday was profit booking in the region of the 200 SMA, something logical and to be expected from traders who had brought near the lows 2 weeks earlier.
On Tuesday, earnings season gets underway and the market can quietly consolidate between 5673-5705 ahead of it on Monday.However any weakness, can also mean a trip through the balance area and can show 5607 below 5640 easily. Another level of support is near the 5550. Resistances for up-moves during the week will be at 5764/77 and then 5834.All the above are future levels for July.
Dollar :
The jobs report is the US brought some volatility to that market this week. We have noted the report to produce monthly highs/ lows in the index periodically.

Most of you may be aware that I felt back in May that the dollar had put in an important swing term low.With so much news filtering around QE2/ US economy etc, there is a big chance that should we break and stay below that 74.8 level marked as value area low on the chart, we should make new lows for the year.
Gold :

I'm purposely putting these last 2 charts up, as during this month Vtrender will be consciously analysing the commodity markets through Market profile.
Yes, we will have daily updates on Gold, Silver, Copper and Crude.
For the moment, Gold seems to have just confirmed a multi-month bottom last week and a further rise from here would bring in new highs for the year.
Watch this space for a daily commentary on commodities, starting this month.
Have a good weekend!
Friday, July 8, 2011

Nifty Road Map 08/07/2011
Nifty Future chart July Series :

Perspective : The bias of the market is easily understood through the value areas and the response of the market in relation to them. Also important is sentiment which is a "feel" of what the market is currently doing versus what the majority expects it to do. We spoke about this in our perspective on July 1st.. Always listen to the message of the market.
Back Ground : Yesterday's open test drive was quick to reject the previous day's value area and the market stayed strongly above VAH all day.Buyers are always stronger above VAH and sellers below VAL.The VAH and VAL levels are the green lines in the chart above.
Chart Speak :
1) Open test drive which visited the previous POC and moved higher above value area high ( VAH).
2) poor highs point to more upside in the morning session.
3) Bias to stay positive above VAH 5744
4) Prime resistance levels on the upside are 5773 ( PR1) and 5797 ( PR2)
5) Below VAH we can expect distribution between 5726 and 5744, even stretching to 5714.
6) 5702 is new support.
The above post is for purpose of education only. Similar charts are posted for the BN, LT, RIL, ICICI, TTM, SBIN everyday on our premium website http://www.vtrender-2.com/
Thursday, July 7, 2011

Nifty Road Map 07/07/2011
Nifty Future chart July Series :

Perspective : Unchanged from yesterday- The 5 day profile is developing into a bell with single prints at 5576 below and 5702 above.Yesterday's profile was contained within the profile of 1/7 and a break of range or a test of the bracket extremes should be the next step in this sideways development.
Back Ground : We spoke about 5665 being important resistance and the market developed a high just above that.The markets weakened once auction happened below 5648.
Chart Speak :
1) Value area developed is between 5653 and 5632.
2) Upside Resistance seen at 5673 today whilst support will come at 5612 below.
3) Trade is still within the profile of 1/7 and any move above or below should fetch the next 60 points.
4) Look for acceptance of price above or below the bracket extremes as price can probe to take out weak hands. Only volumes can confirm price behavior.
The above post is for purpose of education only. Similar charts are posted for the BN, LT, RIL, ICICI, TTM, SBIN everyday on our premium website http://www.vtrender-2.com/
Subscribe to:
Posts (Atom)

