Thursday, March 31, 2011

Mcclellan Oscillator

Most oscillators used as indicators are designed for flatter markets or the non-trending types.

But there is one good oscillator working on market generated information which uses also market internals and is an excellent tools to guage an overbought/ oversold condition in a trending market.

This one is called the McClellan oscillator and we visit it periodically to measure extremes of bullishness/ bearishness.

You can read about the McClellan here:


The McClellan has a reading of 64 currently near the overbought level of 80 but not yet signalling extreme bullishness in the markets. This was at the close yesterday.

Our markets have been up since morning, signalling that we may have a bit more steam left.

And as usual, market generated information works better than parameter based ones.

Wednesday, March 30, 2011

NAV Management continues.

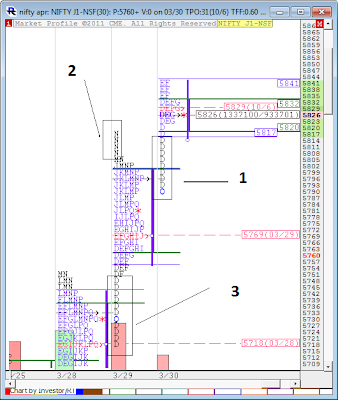
Here is a profile chart taken at 11.00 am this morning.


The chart is that of the Nifty April future :

Point 1 : is the buying prints from the volume point of control of the previous day.We saw a similar buying print from 5710 in the march future yesterday.

Point 2
: Responsive seller of yesterday afternoon, clearly taken out this morning. As a rule, initiative activity is stronger than responsive activity

Point 3 :Buying prints from yesterday's session which took the market up.

For later today : : The market has reached the HVN of 5805 in the march futures today. The 5700 call recommended here at 20/- on Friday is now worth over a 100/-.

5837 NF and 5820 NF are creating the action now in April futures and a sustained move above 5837 should bring 5867 later.Those single prints hold the key to the day.

Monday, March 28, 2011

Profile charts of today

The market paused today near the top end of the 350 point range off the lows of last week.

From last night's post, the market did consolidate but not between 5642 and 5690 as expected, but it was 25 points higher between 5665 and 5714, but the upper estimate for the day at 5728 was kept.

In the process, the profile became balanced indicating that the Steidlmayer imbalance period may be over and we may be making efforts to find a new balance at current levels. Accordingly we shifted our bias from aggressive long to neutral for the week.

Let's look at the profile :


Point 1 : is the low of the day at the top end of the single print mentioned yesterday in friday's profile.

Point 2 : represented the anomaly from yesterday and the repair job was done here today.

Point 3 : the highs of the day near 5728 completed the distribution after rectifying the anomaly.

Point 4
: is of interest tomorrow only on a price probe below 5649. Should that happen 5575 and 5589 should come in play

To answer a few questions now :

1) We have changed our bias to neutral more as a measure of risk than any perceptible weakness which we saw in price today.Our stated position is that the risk of being excessively long is high here considered the series expiry volatility and financial year closings.As we did not go below 5642/ 52, the responsive seller seen earlier today is not strong enough.

2) For tomorrow, if we trade above the point of control at 5710, we should go on to hit 5737 and 5757/64.Minor weakness will be below value area low at 5682 towards 5665/ 5649 below which point 4 mentioned above should play out.

3) On the other question of the 200 dma, our charts showed rotation at the HVN of 5714 and an avid profiler would give that more importance than a lagging moving average. The advantage of profile is that it is a sum of the buyer/ seller reaction of all the possible indicators and tools used by traders. Profile measures all buyer/ seller activity irrespective of the fact that the buyer or seller sold/ bought at 200 DMA or elsewhere.

Have a profitable day.

Sunday, March 27, 2011

One day at a time

In financial markets, the past is history and the future is always a mystery.

Even though we have had a great month of March so far, it's pointless to brood over those results, as they will not help our trades tomorrow.I had a few traders who wrote to me saying that they missed this 270 point show, the market put up last week, despite being regular readers here.To them and to several more, the big question would be now whether the market continues it's uptrend or falls back into the previous bracket.

One day in a market cannot break or make a dominant trend.The idea is always to see continuation or rejection of a new move in the market, in the next session or two.

Let's look at the profile from Friday :


The lines in the chart are the different value areas, represented by price profile and volume profile methods. Whilst, as a blog and as traders, we are sound believers of the volume profile method and by extension auction market theory rather than the market profile handbook, on a day after the one on Friday, I would wait for the two orders to reconcile.

In an ideal situation for Monday, I would expect the market to consolidate the gains from Friday between 5652/42 and 5690.

Strength above 5690 should lead us to the high volume node at 5714 and maybe to 5728. I will be really surprised if the market auctions over 5728 tomorrow.If we do close up for the day I will still be strongly looking at 5800 before expiry.

On the downside, failure to hold 5642 will mean a dip to the large TPO's present at 5590. According to our statistics, a visit to the large TPO of the previous day can happen in 55 % of the cases. On Monday that will be possible only on a move below 5642.

After the profile gets completed tomorrow, we should have a better idea of the strength of the longer time frame player we saw in the markets on Friday.

One day at a time.

Friday, March 25, 2011

NAV Management

As many of you know, we treat the month of March a bit differently than most months purely because of the quarterly and the yearly window dressing seen in the markets over the past few years.

If you have been tracking this story alongside us from an earlier post we had mentioned on march 12th :

" I'll like to break the remaining part of this series into two parts, with the trend being mild to moderately bearish for the coming week and a shift to mild bullish as we come closer to the expiry week"

With the highs of the series being less than 12 points away ( current highs of the day are 5599), it's important to step back and look at where the futures are for the entire series.


We have noticed big volumes coming at the close and have not really been surprised at the gaps we have seen over the past 100 points.

NAV management will continue to be the theme for the remainder of the series.

Thursday, March 24, 2011

Profile precision

Nifty :


Charts from last night.

We said :

-5527/ 5540/5556 possible as long as NF stays above 5507 tomorrow.


High of the day has been 5554

Bank Nifty :


We said :

- 11140 is target on upside.

11134 is high done


We said :

holding 2639, SBI can do 2682/ 2704

2677 is the high

Reliance :


We said :

- RIL can go upto 1024/ 1030 tomorrow.

1025 is the high

LT :


We said :

1552/ 1569 are immediate targets

1564 is the high of the day.

Incidentally both the targets given in the chart posted yesterday were done.

Next week, we will put some alerts out real time for intra day movements here on the blog. You can choose to get notifications in your inbox by choosing to subscribe in the box on top right.

Wednesday, March 23, 2011

Order Flow 23/03/2011

Here is the orderflow of today. The buying and selling of the market is depicted through the Blue/ red lines.

BankNifty :


Nifty :


More details on the use of these can be found on the right of the blog under "OrderFlow"

Ahead of the close

The Nifty futures profile chart as of 2.10 pm is below :


We saw an open drive which was the longer time frame player stepping up.

Value now is being built at the upper end of the single prints from 18th March.

Holding 5460 this market can move up to 5527/ 5556 by tomorrow.

5500 is also the series Point of Control and slow distribution was expected here this morning.

The BankNifty at 10950, SBI at 2640 and RIL at 1011 are at crucial points for the day.All reference levels of importance.

Tuesday, March 22, 2011

OrderFlow charts for today

Here is the orderflow of today depicted through the Blue/ red lines.


Bank Nifty :


Nifty :


More details on the use of these can be found on the right of the blog under "OrderFlow"

It's over !

It's a story I have been tracking for over 3 months now, even stopped following currencies as lead indicators in the trading room and can now declare that the co-relation is over.

The co-relation is that of equities and the dollar.

Take a look at some charts below of the USD/ Euro and the Nifty spot :

This is the euro against the Nifty spot.


Historically euro up has equated to a NF up.

The next chart is of the dollar and the Nifty


Yes the two rectangles are both pointing down from 2011.

and the dollar and the euro ( seems all right here)


Next time if somebody tells you that Dollar down equals equities up, tell them to have a look at these charts.

As a leading emerging market player, the story seems to be a bit more than what the charts are projecting at the moment.

In fact if the charts play out through 2011, we will soon have the rest of the equity world stand neck to neck with our dear Nifty.

The charts clearly show that our stocks have decoupled from their inverse correlation with the dollar and the Nifty seems over eager to join the dollar down bar for bar.


The decoupling may be due to rising inflation which eventually will hit at profit margins causing equities to run the same was as currencies are now running. It would also mean a strong flow into commodities and the recent buying tail which we saw in gold futures just after the balanced profile may be a sign that that particular low will be here for some time to stay.


When all that happens, the dollar will be buried as the reserve currency of the world ( about mid 2012 ) and the grounds may be ripe for a new bull market to emerge from there.


Of course, currently the dollar is hanging onto a slender thread ( red horizontal line) , but it is hard to see it not fall off by another 10 % to about 67 thereabouts.


For those who think that that 10 % fall ( hopefully in next 3 months) will be matched by a 10 % rise in our markets will have to look back at the charts again.


It's not happening...

Friday, March 18, 2011

Update on Yo-Yo

We have finished two more days since our last update on the Nifty

Whilst analysts have been busy alternating between buying and selling the market for the past 100 points, we have preferred to track the net difference between buyers and sellers for this week, which was neutral along with price two days back.

Here is an updated chart to the one that was posted two days back :


Yesterday's move down in the Nifty was not majorly supported on huge sell volumes, but effectively the sellers are more in control as the week has shown.

The reading at the close for the past four days is slightly lesser than the preceding four days of delta.

Overall the market is still confined within the green line and the red line as shown.

A break of either level this week will point to the presence of new selling/ buying activity this week.

We will continue to track the movement of delta real time in our trading room.

Thursday, March 17, 2011

Orderflow from yesterday

Here are the orderflow charts from yesterday.

More details and previous posts on the subject of orderflow can be found on the right of the blog under OrderFlow.

Bank Nifty :


Nifty :

Tuesday, March 15, 2011

Yo- Yo

We closed at the level we started yesterday morning.

So what changed...Only a lot of money.

Retail got shut and FII's bought.

This chart below will hopefully explain.


The chart is for a 2 day period.

The lowermost pane is effective volume or the net difference between buy volumes and sell volumes. The chart was sloping down all through yesterday and from this morning it sloped up before we had a 100 point rise in the markets.

In the weekend post, we mentioned "It's not a time to be too adventurous with leveraged positions, but to be careful with a good understanding of risk-reward for short term trades".

There is no shame in sitting out of the markets.Markets will always remain, it's the people within who will change.

And.. you don't go looking for trades, you just recognize them when they appear.

Saturday, March 12, 2011

Nifty March series outlook.

Last weekend, when we looked at mid term and short term charts of the Nifty spot, we identified two regions for the Nifty, one around the 5550 zone for the medium term and another around 5472/93 for the short term.

At the end of the week, the Nifty found itself closing below both the mentioned levels.

In a trading environment, which is increasingly being dominated by news flow from east to west and with the mid-east also demanding attention it pays to be extra careful in the markets, regardless of what the technical picture may be projecting at the moment.

It's not a time to be too adventurous with leveraged positions, but to be careful with a good understanding of risk-reward for short term trades.

Come Monday, the news flow from Japan and the EU conference will affect our Asian markets and the Europe open one way or the other. We also have the RBI policy which can keep the Banks muted in the early part of the week.The Bank Nifty did not support the down move of yesterday afternoon and without it's participation it is difficult to see the larger Nifty move strongly during the week.

Let's turn out attention to the Nifty March future with an eye on what the expiry may be on the 31st of march.

I'll like to break the remaining part of this series into two parts, with the trend being mild to moderately bearish for the coming week and a shift to mild bullish as we come closer to the expiry week.

The observations are from the chart posted below. I'll elaborate :


Based on last weekend's post and the fact mentioned at the top that we could not clear the week above 5472 and 5550, we may be headed towards 5377 and 5340.

The composite profile shows heavy volumes now at 5500 regions which could be new shorts having entered the market yesterday. Certainly the region around 5500 would be a stop and reverse for the rest of the series.5300 should be the extreme end at which the market can go to, below which the new buyers ( green candle in the pane) would give up all hope.The low volume zone around 5400 has not indicated a great preference for auction ( as expected in profile), with two 50 + point moves above it this week.The vwap for the series is 5460 regions where we closed yesterday and seems to suggest that the bulk of the volume is below 5500 levels for the series which is also the preferred region for auction.On two counts therefore, 5500 would be a good stop for shorts.

Now for the second part of the series, where the outlook should be bullish.

Last March, we had an amazingly profitable time at Vtrender with our theory on seasonality and markets. You can catch that post from last march here.

Basically the theory is that the month of March is a profitable series for bulls and should close at the highs.Now like all theories, this one also needs to be taken with a pinch of salt, but profile also teaches us that markets have memory and tend to do things which they have often done many times before again and again.

So we'll watch for the bearishness to subside and the bullishness to begin.

To that end, the news flow this week should help.

Friday, March 11, 2011

Intra day Order flow

No case for longs here...

Thursday, March 10, 2011

Pnf Charts and volumes

Here are some Pnf Charts of the Nifty and the bank Nifty of today and the volumes for the reversals taking place.

We like to look at the pnf charts as reversal tools and the larger studies around price objectives and patterns is largely ignored.

There are 3 panes, the first one for price, the second is for the volumes behind the price movements and the lowermost is the effective volume of all prices.


Auction theory gave us a two way auction today and a balanced profile between buyers and sellers.

It's two way markets of today which tell us to have a closer look at volume information and the pnf charts are another way of looking inside the candle.

In the early part of the day as NF was sliding towards it's lows, there was effective buying happening ( 3rd pane) which discounted the possibility of a slide lower.Eventually the market got up.However as the market tried to move higher in the last 30 mins of trade, notice the red candles in the bottom most pane which should be on watch tomorrow for continuation.


In the BankNifty also, the big green candles of the second pane are met with red below and vice versa.

Effectively speaking selling was met with buying and buying with selling, and the resultant was a range bound day.

Saturday, March 5, 2011

Nifty Weekly status

We had an interesting week in the markets and the last two days were spent on consolidation in the upper end of the profile after the big trend day on 1st of March.

In many ways the big trend day was a game changer and the structure still holds value upwards as long as the region of 5470-82 is protected in the short term.

But let's step away from the short term and let's see what the markets are doing over the mid-term with probabilities for the long term scenario.

Here is a weekly chart of the Nifty spot.


It's a weekly bar chart stretching back to 2250 levels, but for purpose of clarity I have chosen to highlight only the last one year of bars.

If you have been following the markets closely, you would have noted the markets coming back to and falling off from this region where we have closed yesterday.

On a monthly time frame, this area ( point 1) is the high value zone for the entire up move from 2252 to 6338 and there is good reason to believe that if we close march series above this level we will be back on our ways to previous highs and maybe more.

Also around this zone is the developing weekly value ( point 2 at 5524) for the downtrend which has been in place from November last year.

So for the medium term, if we cross these levels (5550) , it should bring 5900 ( point 4) eventually.


Let's turn to the short term profile.

We'll look at the march future.


The profile chart shows :

a) a seller at the top near 5610 levels. This seller on 18th Feb at the same level had dropped the market to 5230 by the 25th ( one week)
b) short term support is 5472-93 below which we will see 5377/ 5340.
c) If the single print and 5646 is taken out, this market can race upto 5805 in no time.

Safe trading.

Wednesday, March 2, 2011

OrderFlow from Tuesday

The markets put in a strong trend day on Tuesday, with the speed of the moves increasing over 5440 and 5480.

Generally what follows a trend day is a balancing act, and we would wait to see if the markets can consolidate in the upper end and build value again.What would not help at the open is the loss of a day in trading when other markets have been functioning. Conservatives in such cases would wait for the initial balance to be developed before attempting intra-day positions.


Nifty :


BankNifty :


-5481 and 5421 are intra day supports
-5521 needs to be watched in the opening prints.
-5593/ 5663 are tgt above.
-consolidation/ balancing would be good before any up move.

Tuesday, March 1, 2011

Power of Profile

Here is the analysis posted last night on Vtrender-2 for the Nifty .


Monday, February 28, 2011
Profile charts for 1st march
Posted by Shai at 9:58 PM


- Nifty closed at the developing POC indicating balance for the day
- Buyers are holding the levels at 5304-5314, below which Nifty failed to auction today.
- 5304 will be a stop and reverse level for longs with target of 5229 below and 5391 above
- an auction back to 5391 will complete a balance profile for a directional 150 point (min) move either side.


When everybody was bearish, we played neutral as POC told us that buyers were in the market and longs with a stop n reverse at 5304 would have been an excellent risk/reward trade.