Monday, January 31, 2011

Bounce

Heading into the open of today, we had a 3I day as a background.

The early morning inventory was short and the market wasted little time in getting near the level of 5435 mentioned in the weekend post.Incidentally the low of today (5438) was last seen on the 1st of September last year.

Once the seller was neutralized, the only message from the market we were looking at was strength above 5484 and movement at the previous day's Point of Control.


There was responsive selling at the POC, but further buying later in the session turned it into a profitable day for the bulls.

Tomorrow morning the market will look for 5504 to protect the buying after which we can once again see 5549 and then 5580 and hopefully the big 5625.

In the BankNifty the poor lows mentioned at 10530 were broken to the downside and the lows from 14/ 1 and 17/ 1 were re-visited before the BankNiftyy made a reversal and closed higher at 10660.


Strength above 10740-10760 will put a revisit of 10900 back on the cards.

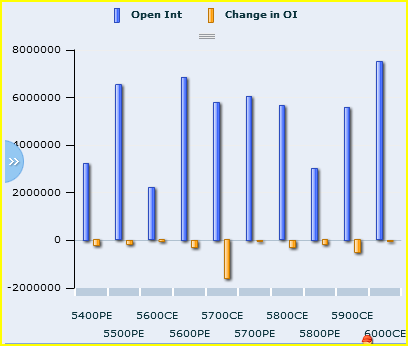
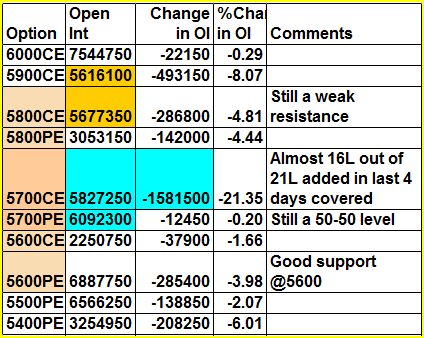
Options/futures data for 28th Jan (EOD)

After getting somewhat acclimatized to my new job, I am trying to return to normalcy in my trading/Open Interest analysis. 


Summary:
1. The FEB series started off with a tank below quite a few familiar levels to traders for the last 6 months, making market pundits to go back and redraw trendlines, channels and even start looking at weekly and monthly averages! Options table though is not suggesting a lot of bearishness but we now live in the world of 20-20's where 20L calls can be written in a day and 20L puts can be covered in a single day. So anything can happen going forward.
2. Current range suggested by options data is 5700-5500, with 5700 still a a not-so-strong resistance but as mentioned above - this is just the first day of the series.
3. 5600 is the 50-50 level with negative bias due to the 20L calls added on Friday
4. 5500 is a reasonably good support as of now with almost 60L puts vs 16L calls.
5. PCR is at 1.31 - not suggesting a whole lot of bearishness but as the saying goes 'you can't judge a book by the cover'. We did have 1.4+ PCR on the very first day of Jan series and there was 600 point fall by the end of the series! 


Nifty Futures:
2.05 Cr OI up 5% (9.8L shares added) -- Mostly shorts?


Banknifty Futures:
10.8L OI up 5% (0.5L shares added) -- Around the same levels in August Banknifty OI was 30L+ and in September it was 24L. I believe that unless Open Interest increases in Banknifty, we might just be in for a consolidation phase for next few months in banks.


Most of the Open Interest action(addition) I have seen recently is in mid-cap banking space esp in stocks like YESBANK, ORIENTBANK, SYNDIBANK .. So may be some accumulation of these banks has started but gains are not reflected in price yet. 


Herd mentality:
There was a time a few months back when everyone was chasing the hot midcap stocks like RECLTD, PFC, PANTALOONR, EXIDEIND, KTKBANK, DHANBANK, PFC, OPTOCIRCUI, FORTIS ... Today they are reasonably priced but no takers for them!

Saturday, January 29, 2011

Nifty Breaks it's 2 week balance

In my Last post I had mentioned that the noise around the settlement day was not clinching evidence to signal a change of trend but to quote from that post again " Sometimes what didn't happen has more implications than what actually occurred."

The open was crucial as a follow up to that afternoon's move and the open left nothing in doubt.


The sellers managed to take the Nifty future down 150 points in a session before some exhaustion in the Bank Nifty and some opportunistic buying as well as short covering in the Nifty future managed to take the Nifty up about 70 points from the lows.

The area around 5625 was a high volume zone noted at the close of trading on the 27th. In hindsight it represents the area where new sellers have entered the market and are ready to pin the market lower.

People who follow parameter based indicators would recognize this zone as the 200 DMA.But believers in market generated information should not hold any level as sacrosanct or too big for the market to scale.

Strength above 5625 will put 5685/ 5725/ 5785 in play. Each of these levels will be used by sellers to re-enter short positions in the market.

Looking down we have Friday' s 5481 and then 5435 and 5373 as the next major supports for the market.Break of one should lead to the other.

For those of you who were wondering what happened to the OrderFlow chart of the Bank Nifty after my intra-day post, here it is :


The profile picture posted yesterday put in a poor low at 10530, in itself a reason to revisit that level again. We'll see if it breaks the second time it gets there.

To close, I drew up a chart to represent the times, the Bank Nifty has been out-performing the larger nifty.

Have a Look :


It's a 40 day chart where Blue represents the BankNifty future and the Green the Nifty future. It's only from the 24th that the BN has been out performing the Nifty.The banks are important to our investment portfolio and we'll continue to keep an eye out for this relative strength.

The ratio of the two is turning into a contrary indicator with an upswing marking a decline in the indices and vice versa.

Some thing to chew about over the weekend.

Have a good one everyone. !

Friday, January 28, 2011

Bank Nifty Hesitates ( Intra action )

Whilst a lot of us are pertubed about the movement of the Bank Nifty future and the fact that it is not making new lows along side the Nifty, here's a chart which explains ..


It's finding support from the High volume node of the profile dated 17th Jan from where it had launched off to 11280.

If this level gives way then there is a 100 point fall ahead at the minimum.

Meanwhile here is a chart of recent OF action :

Thursday, January 27, 2011

Nifty Feb Future

Often times a view which one holds at the start of a session can change as the market keeps sending out a message.

We walked into this expiry day, expecting a close around 5700 which was the fairest price for the series for both buyers and sellers. Also the Open Interest build -up at 5700 by writers of both the calls and puts was strong enough to justify the thought process for an amicable close.

Instead the market had other ideas and for the second time in two months we had a settlement at the extreme end of the series and in favor of the party who had dominated from the very beginning.


The daily chart above should not leave anybody in doubt on who had control through the series.The blue horizontal lines represent areas of new selling and should the buyers test them again, they will have sellers coming back at them with renewed energy.

But the question which stood out on an intra-day basis, was whether profile by itself suggested that we may end at the lows today?

It certainly did.

Have a look at this chart against the one I posted yesterday.


Two things stand out :

1) A selling tail at the open

2) An inability to auction above 5676-5688.Once 5676 was broken, the lows of the bracket were definitely at play.

For Tomorrow :

a) We wait and see if the market gets back in the bracket and if 5676 is tested.

b) Monitor the open to know whether today's late move was settlement only or has larger implications.Clues to watch would be whether Open is in value and range.

Sometimes what didn't happen has more implications than what actually occurred.

Wednesday, January 26, 2011

Nifty Expiry- Jan

Generally, the end of any series carries with it a little excitement on where it would end and pundits are known to record the value as a future reference.

We at Vtrender do not give any more importance to the closing expiry price than the close of any one trading day, and the larger auction process moves on regardless.

But we do have a little calculator which helps us arrive at an approximate range for expiry many days before.

That calculator has calculated the range of Thursday's action to be 5625-5748.

Before we get into the Open Interest break-up, let's look at the longer term view of the Nifty Jan Future in terms of Profile structure for this series.


The purple zone is where the Market has traded 70 % of the time and it's chosen region to auction.

The price point of control at 5700 represents the pivot around which moves have been made and should be the same for tomorrow's session.

Profile by itself would indicate the region around 5700 as a fair settlement price for the series.

Let's shift our focus to the Open Interest at 5700 strike for Jan.

5700 Jan CE :


The table is for the Open Interest over the past five sessions here. It shows a reduction of -850650 units and a total OI of 5992500.

5700 Jan PE :


Reduction of -156900 here over 5 days and a prevailing build up of 5034800.

The picture cannot be complete without considering rollovers as well as the Open interest in Feb at the same strike

5700 Feb CE :


1666200 added and the total OI is 2516400. Most of it added in the past five sessions.

5700 Feb PE :


1371550 added against 3315400 as total Open Interest.The chart shows almost a 100 % rollover from Jan to Feb.

So Open Interest clearly shows what profile has been saying all along - that there is uncertainty or in the language of profile a balance prevalent in the current market structure.

I won't be surprised if we expire between 5700 and 5716.

Nifty Update

We were trading the January Future yesterday, but for tomorrow's action we'll shift focus to the Feb futures.

Why?

There's a reason. At all times in the market we are looking for the presence of a longer term player who has a view of the market of more than one day. That person will be trading the feb tomorrow and it will be left to the day time frame to negotiate the Jan particularly from noon.Also we are "volume people" and there will be more volumes in the feb than in Jan tomorrow.

Here's a chart of Feb Action :


Looking at this chart I only remember one saying which I learn't years back : " From failed moves come fast moves".

As the Nifty opened above the previous excess zone of 5775 ( 5750 in Jan future) and buyers made a conscious attempt to stay above that level, the news flow in the afternoon was responsible to create a small selling tail at the top and a breakdown below value and Monday's open price added to the downside momentum before the High Volume Node from 20th Jan ( pink dashed line) arrested the downtrend.

The market continues to be in balance in the weekly time frame and only a break down below feb level of 5640 will invite fresh selling.

Bank Nifty :

In my last post on Bank Nifty I had stressed on the importance of the 10930 zone as well as the auction of the 14th of jan as a defining point for the Bank Nifty.

Have a look at what happened since :


The break above brought 11290, but the subsequent sell-off has brought us back to last friday's closing level exactly.

The profiles are each marked in the rectangles alongside.

From the current closing level, 10973 on the upside and 10873 on the downside should be watched for direction.

Tuesday, January 25, 2011

Order Flow

Here are the Order Flow charts from today :

Nifty :


Bank Nifty :

Watch the Euro

As the market waits for the RBI announcement, what has baffled most analysts has been the sharp rally in the Euro over the past 2 weeks.

The euro has held near 1.37 all of this morning, and no real signs of weakness can be seen despite a 6 percent rise.


Up ahead is the high volume zone of 1.385- 1.39 which was the levels the Euro was trading pre- QE2 announcement by the FED.

If it continues moving higher, all the bearishness in equity markets would evaporate.

Sunday, January 23, 2011

Options/futures data for 21st Jan (EOD)


Summary:
1. Options table is still in the 'state of flux' and the best data to substantiate that claim is that OI of 5700CEs is higher than OI of 5800CEs. The puts are covering on lower levels and calls are not adding massively on higher levels. It looks like only a break of the 5628-5745 or 5770 (NF) would give some meaningful direction to the markets.
2. 5800, as described above is a resistance but not enough calls in OI to call it a big resistance.
3. 5700 is a 50-50 level with negative bias because of Friday's action of call addition and put covering. But don't be surprised if a trend day emerges out of nowhere and takes the market up massively because sentiment is reasonably negative and Banknifty the leader is showing some strength.
4. 5600 is a strong support as of now
5. PCR dipped back to 0.89 from 0.91 -- but it hardly martters now given that its only just 3 days left for expiry.


Nifty Futures:
Jan: 2.14Cr OI up 3% (6L shares added)
Feb: 40.6L OI up 23% (7.8L shares added) - OI addition in both series. Some big move brewing?


Banknifty Futures:
Jan: 10.6L OI down 6.8% (0.78L shares cut) - Very good amount of short closure (almost 30% OI cut) seen in last few sessions in Banknifty and SBIN saw a 12% OI reduction last Friday. Still everyone seems to be cautious on Banknifty ahead of RBI meet on 25th Jan. Stocks typically like a 'wall of worry'. So will market feed off the negative view on Banks and stage a rally?


PS: From tomorrow (24th Jan), my professional career would be taking a different path where I may not be able to keep in touch with markets on a day to day basis. I still hope to associated with markets by analysing the Options/Futures data and EOD. If in case you don't see me posting options data regularly, please be considerate on this poor soul entangled in the tentacles of corporate world!

Saturday, January 22, 2011

OrderFlow

I got a mail from an individual comparing the performance of these indicators to something he has devised claiming his method to be superior.

Incidentally he refused to divulge more info other than the superiority factor.

I wish him and all other individuals the best, if they have something better to help them improve their trading. It was never our claim that we have found the "holy grail of trading" or the best system of trading known to mankind.Neither are we in competition with anybody else for a performance ranking.

Our orderflow indicators are trend indicators in 2 time frames for intra-day and help us to make proper decisions to buy/ sell or exit as the market keeps churning out new information.

As regards to the Holy Grail- everyone has one- the one between your ears, provided you know how to use it wisely.

Nifty :


Bank Nifty :

Friday, January 21, 2011

Daily Charts : Corrections

Here is is a daily bar chart of the Nifty spot, showing activity over the past twelve months.


This is the 4th Big correction in the past twelve months and each of them are shown in purple rectangles.

Each correction has so far done the stipulated 600-650 points, the normal correction of the NSE generally.

Time wise also the two corrections are spaced out in the correct order and seem to be following the same pattern again.

I've also included the 50 Sma and the 200 Sma for a trend check and we have defended the 200 sma successfully near 5614, the traditional line that differentiates the bull and near markets.

So the Boxes and the sma seem to say that the correction is over.

Will markets listen to History?

Options/futures data for 21st Jan (EOD)


Summary:
1. The last 2 hours of short covering in Nifty/Banknifty seemed like the market was paying back bears in the same coin for what they did last Thursday and Friday.
2. The OI table is an interesting juncture where 5800CEs have less OI than 5700CEs! So I don't know what to say about 5800. For lack of better words, we have to call it resistance but its hardly a resistance if some massive buyer steps in and decides to take the index up.  But the question is - does someone desperately want to buy Indian stocks? - esp given inflation/rate hike and high commodity prices (Oil/Copper ...)
3. 5700 is the 50-50 level, although a very big chunk of calls were covered yesterday. Now all that is left is the 22L calls that were added on last Friday.
4. 5600 still a decent support, although I would have expected puts to be written not covered!
5. PCR slightly up from 0.88 to 0.91


Nifty Futures:
Jan: 2.08Cr OI down 4% (4L shares cut) 
Feb: 33L OI up 27% (7L shares added) - Decent rollovers happening and given that we have only 3 trading days in next week, I would expect one more massive 100+ point day in next 4 sessions to facilitate large rollovers


Banknifty Futures:
Jan: 11.4L OI down 5% - As mentioned yesterday, Banknifty OI is at probably six month low. A sweet SPOT for some market maker to enter and create a rally or Indian Banks is a yesterday's story?

Thursday, January 20, 2011

Bank Nifty

If you have been following the blog for sometime you would know of us as passionate Bank Nifty traders.

Most of the time you will see on this blog a Nifty chart along side the Bank nifty.

Our reasoning is very simple- We Consider the bank Nifty as the leader of the two instruments, a fact which has helped us and kept us ahead of some major moves of the market.

So as the market revists the 5750 zone, it pays to keep an eye on what the bank Nifty is doing currently .

Here is the profile chart of the past five days :


As you can clearly see we have operated this entire week well within the 10960- 10380 range set on the 14th of Jan.

Today the bank Nifty stayed above the 10488 point of control of the balanced profile on the 17th of this month( brown dashed line). Infact it was the low of the day today.

Relatively speaking it was much stronger than the Nifty future which broke below it's level of 5661 in early action today.
The high of the day today was actually the point of control of the profile dated 14th of November ( brown dashed line from 14th ).

Much of what can happen tomorrow will depend on how well the Bank Nifty can negotiate with the seller at 10920-10940.Success here will easily bring 11040 and 11185/ 11270.
If the Bank Nifty does manage to do that, then we will be witness to the nifty future flying over the 5750 level.

Supports will be at 10824/ 10736.

Options/futures data for 19th Jan (EOD)


Summary:
1. While the market kept pushing up above 5700, it seemed like it was on borrowed time and Europe opening blew the air off the balloon.
2. 5800 is still a weak resistance but the difference between puts and calls is slowly widening to almost 30L making it almost a decent resistance. I would still have liked to see more than 70L calls @5800 to declare it a strong resistance.
3. 5700 is still a 50-50 level
4. 5600 is the strong support. May be today the 5600PE writers' courage and pockets will be tested
5. PCR making new 6 month low of 0.88 but like September series when PCR kept on pushing the limits on upside, this market also seems to be adamantly pushing the limits on downside. In markets as someone has said - stocks take the escalator route up and express elevator route down!!

Nifty Futures:
Jan: 2.17Cr OI up 1% (22L shares added)
Feb: 25.8L  OI up 26% (5.4L shares added) -- Next month seeing good OI build up

Banknifty Futures:
Jan: 12L OI down 2% -- OI is now down 65% compared to its peak in August and more than 50% down compared to its September breakout point! For me the simple rule is "Open Interest is equal to Trading Interest".

Wednesday, January 19, 2011

Options/futures data for 18th Jan (EOD)


Summary:
1. The bulls did gather some courage and finally got Nifty over the 5700 hurdle but it remains to be seen if they have a lot of ammunition to counter the bears operating from levels like 5745-5770-5815 (Nifty Futures).  The options table though didn't see any big change expect the fact that a good chunk of 5600PEs, along with some 5700 & 5800PEs got covered. The range suggested by options is still 5600-5800, although 5800/5900 as of now can be considered weak resistances because not many are writing calls at 5800 or 5900.
2. 5800 is a weak resistance
3. 5700 is the 50-50 level. The direction for this market depends on the 5700CE writers who added 35L in the last few days!
4. 5600 is the support - despite 11L 5600PEs covering it looks safe for now.
5. PCR is 0.89 now. Its truly amazing that we have seen extreme PCR readings of 0.89 and 2.0+ in just a matter of 4 months!!


Nifty Futures:
2.15Cr OI down 5% (11.5L shares cut) - 14.5L shares were added on Friday's massacre and 11.5 of that gone today! 


Banknifty Futures:
12.3L OI down 4% -- BN OI now has gone below what it was on the first day of this series. Shorts have completely booked out. Now it remains to be seen if longs would come in and take the index up.


Balanced profiles:
Inspired by Shai's post on Balanced profiles yesterday and today, here's my contribution through pictures - no explanations needed. 


Which stocks have these balanced or almost balanced profiles? ICICIBANK, RELIANCE and LT
And what's the importance of these stocks? These three along with INFOSYSTCH & HDFC make up almost 40% of Nifty!


Tuesday, January 18, 2011

Power of Profile

It's been my long held belief that if you are not looking at the markets through price and volume as a combination, you are in fact looking at the market through one eye!

Over the years, in chats with several traders I have found that those traders who watched volume alongside price always emerged more successful than the ones who followed only price and price based indicators.

There are several different ways of watching price and volume together and these are as varied as the different methods employed by successful traders over the globe in reaching the same objective-to be successful in their trading.

Surely in trading it's the ends not the means, and if you are successful then it does not matter.

But if you are still looking to get that edge to define your trading, and googling for a methodology or a trading system, then there is none better than Market Profile.

Consider these words from yesterday's post here :

Both of them are forming bell shaped curves, indicating balance coming back to the markets.Whilst this does not discount the possibility of another sharp spike lower, today's action does indicate exhaustion of the dominant trend.

If the market needs to go down , it would be new sellers who will have to enter to bring it lower, but any good upmove will put 5745 and 5815-30 back in play.


If you have been studying profile , it wouldn't have been difficult to figure the 80 points from close to close. Or the fact that we stopped 3 points away from the 5745 level ( why ?) or the low of today was value area high from yesterday ( how ?).

I had posted a chart earlier on the impact value areas have on the motion of the markets.You can find that same chart here

These markets can be tamed and you can be profitable as much as any big institutional player or fund house.

You just have to choose the correct way.

Order Flow charts of today :

Nifty :


Bank Nifty :


Charts need to be read as blue for buyers and red for sellers. More details about OrderFlow are there in last night's post.

NF daily profile

Here is a chart of the NF daily profile showing volume accumulation as well as all the HVN's and LVN's.


The chart is daily prices.

The brown shaded region represents the volume traded as a profile.

The red lines are low volume nodes.

The green lines are high volume nodes.

Clearly the largest volumes are traded at 5810-5824, which will have to be taken out on closing basis should the Nifty future want to march upwards.

Options/futures data for 17th Jan (EOD)


Summary:
1. Options data still seems to have those confused levels 5700/5800 but the activity of buying 5400/5500PEs and also addition of 35L 5700CEs makes it look like we are just one more day from printing a RED candle looking at which Foreign Investors will say -- "there goes my India story into the dumps". ( http://www.marketwatch.com/story/india-etfs-dive-on-inflation-rate-jitters-2011-01-16 Although my positions is now long in 5700CEs - I would be switching to 5600/5500PEs if 5620-5630 breaks on downside.
2. 5800 is the weak resistance. The good news for bulls is that no new 5800CEs are being written despite the large fall from 5800+ levels
3. 5700 is now a truly 50-50 level.
4. 5600 is a reasonably strong support.
5. PCR had negligible increase from 0.90 to 0.91 -- still in a "reversal possible" zone.


Nifty Futures:
2.26Cr OI flat -- No sign of short covering!


Banknifty Futures:
12.8L OI down 0.8%

Monday, January 17, 2011

Trend Indicator Charts for today

Here are the orderflow charts of today from the trading room.

Nifty OF :


Bank Nifty OF :


I have received a number of emails on the subject of these orderflows.

I wish to touch on a few points.

1) Even though I use the word "indicator" to describe the OrderfLow, it actually is a trading system designed for trending & non-trending days in the market and even two types of intra-day traders.

2) The Order Flow is actually a trend indicator and one of the most powerful out there.

3) The flexibility we have is our advantage to see both of them work together in live markets and in different situations.It's like riding this market in 2 "gears". One needs to use the right gear whilst trading the market

4)The smaller green-pink is for range bound days and the larger Blue-red is for trending environments.Use the lower gear for range bound markets and the higher one for fast paced trending markets.

4) The Order Flow is the general buying and selling of the markets. The Markets are driven in the direction of the larger demand or supply.Since OrderFlow tracks changes to the same, it cannot go wrong.

5) The OrderFlow trend indicator system will work in all markets and every timeframe.The past two days of activity -trending & volatile on friday and non trending & volatile activity of today are the best barometers to check the utility of these systems.

Hope this clears the air.

Non Trend day

The very first 30 minutes of trade were enough to give us an indication that this was a day which would be different from the ones we had seen last week.

After a few neutral extreme days back to back dominated by sellers, the markets put in a non trend day today moving within a range and generally splitting honors between buyers and sellers.

Sellers were unable to pin price below Value area Low of 5638 and buyers made an unsuccessful attempt of a range extension earlier in the afternoon.

The result was a balanced profile and a close at the developing point of control.


The chart above is that of the Nifty Future with two profiles-the one on the left is the composite profile for last week and the smaller one is the profile for today.

Both of them are forming bell shaped curves, indicating balance coming back to the markets.Whilst this does not discount the possibility of another sharp spike lower, today's action does indicate exhaustion of the dominant trend.

If the market needs to go down , it would be new sellers who will have to enter to bring it lower, but any good upmove will put 5745 and 5815-30 back in play.

I had a question over the weekend about the utility of our smaller Trend Indicator especially after the big show by the blue-red Trend Indicator over the past several days.

The Green-Pink Trend indicator is there for a purpose and it's utility was seen today in a range bound day.

Have a look :


Green is for buying and pink is for reversing.

There were over 8 trades, each yielding over 20 points in the Nifty Future.

In the days of 200 point moves, 20 point moves look small but can still be lucrative!

Options/futures data for 14th Jan (EOD)


Summary:
1. Finally the car was pushed to the other side of 5700 and it was done with quite a prep till afternoon! The options table is now in a bit of confused state with still OI @5900/5800/5700 - all suggesting that its still not all over for the bulls. BUT one of the traders interviewed by Jack Schwager (the author of Stock Market Wizards) has said  “When a market makes a historic high, it is telling you something. No matter how many people tell you why the market shouldn’t be that high, or why nothing has changed, the mere fact that the price is at a new high tells you something has changed.” Applying the same thing here - 5700 (Nifty Fut) was such a big support for past 45 days - the mere fact that market broke that support is telling us that there is more to come!
2. 5800 is a weak resistance because you can call it almost a 50-50 level with 60L calls vs 49L puts. Also its interesting to note that there were no calls added @5800 on Friday! And some 5900CEs covered
3. 5700 is a weak support but the bias is clearly negative because of the almost 20L calls added on Friday.
4. 5600 is a strong support but bears are in @5600 too with 22L calls getting added on Friday @5600
5. PCR is now at 0.9 - never before seen level in last 5-6 months since I have started tracking!

Nifty Futures:
2.26Cr OI up 6.8% (14.6L shares added!) -- Looks a decent amount of shorts but if one views this in conjunction with 5600/5700 calls added, these might be covered calls too?

Banknifty Futures:
12.9L OI down 2% (0.3L shares cut) -- Some shorts covered. In fact BN has not had mostly OI reduction in last few days and its approaching July breakout point of 9900-10000. Effectively Banknifty is down 22% from its Diwali peak and several banks have even touched/gone below OCT 2009 peak. All I can say is risk-reward may not be in favour of shorts in Banknifty esp after almost 3000 points of fall in about 2 months. But market will always do what it wants to do ..


Friday, January 14, 2011

Disbelief

The story of the day today was high volatility and complete dis-belief.

The sell from the open at 5760 was looking like 5550 very early in the morning when it turned and moved away from the morning lows to 5780 and then 5810 and before you could react you had 5855 printed.

What followed was even more intriguing as the market failed to hold 5814 yet again and toppled this time for good to reach the Other objective near 5630. It didn't-missed by 7 points again.

As Girish said, the car on the cliff was pulled and pushed over by even more momentum. The sellers are sadistic Pi**.

Luckily for us and for our guests in the trading room, we had orderflow indicators designed to catch all the volatility of the markets.

4 signals today :

1) short at the open with an OrderFlow red.
2) Buy at 5725 when it changed color to blue.
3) reversal at 5735 which was actually a whipsaw for a 12 point loss.
4) short at 5735 again till 5670 was printed much later in the day.

Have a look :


The total gains in OF were 260 Nifty points in the 2 big trades of the day.

In the Bank Nifty there were 3 profitable trades today :

1) short at the open with an OrderFlow red.
2) Buy at 10700 when it changed color to blue.
3) short at 10900 again till 10420 was printed much later in the day.


The total gains in OF were 680 BankNifty points in the 2 big trades of the day.

Looking into next week, the markets will continue to be volatile, but with such good indicators for direction one need not worry.

Bring it On !

Balance

I got inspired by Girish's "Car near a cliff" analogy and decided to post a few charts to explain the concept better.

Have a look :


This is the activity chart of the Nifty future this week illustrated through the use of market profile.

And the Bank Nifty future :


Random movements of the markets and the volatile nature is best shown on these 2 charts.

Now take a look at these two :

Nifty Future :


Bank Nifty Future :


The 2 charts above are a consolidated profile of the past 4 days of action.

It shows clearly what the market is trying to do here.

The Nifty future clearly shows a balanced profile developing over a 4 day period with a point of control around 5810.

You last heard about a balanced profile and the impact it has on a market in this post
here


You last heard about the importance of the 5810 level in this post here

There is a directional move ready to unfold.

Use 5810-20 to manage the risk.