Tuesday, August 31, 2010

Options/futures data for 31th Aug (EOD)


Summary:
1. Despite the fall to 5350(SPOT) not much of 5400PEs were unwound. So 5400 put writers are providing the support below 5400.
2. Not much call addition at 5500/5600. Keeps the possibility of a pullback still open.
3. OTM (Out of Money) puts addition at 5200/5100 and lower levels is still cautioning that some traders are playing for a deeper correction from here.
4. PCR is still around 1.43. As mentioned before Nifty tends to top out when PCR crosses 1.8 - Two instances June 21st (around 5370) and recent top above 5500 just before Aug expiry.

Nifty Futures:
3.23Cr OI down 0.1%

Banknifty Futures:
23.8L OI down 2% - some evidence of short covering in Banknifty?

Turnover comparison between first few days of Aug/Sept series:
The total turnover was pretty high today- About 1.06 Lakh-Cr. Comparison between August Series and September series is shown in following GIF.

It looks like options turnover almost doubled compared to first few days of august series.In my past experience - increase in options transaction indicates much higher volatility is expected in this series.


Monthly chart of Nifty:

Nifty went below monthly value area and closed just inside the value area. Nifty trading well below monthly VWAP and its provided resistance on Monday.


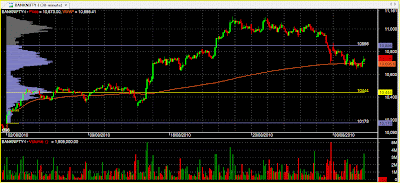
Banknifty seems to be getting support around the monthly VWAP

Monday, August 30, 2010

EOD report on 30th Aug

As expected after the strong US close, the market gapped up big at the open this morning, very close to the HVN at 5465 we have been tracking from well over a week.

Infact it was to be the high of the day.


Ideally it was the perfect opportunity to set up a short at a proven level, but in view of the large gap and the possibility of continuing momentum, not a high probability trade.

Anyways the sellers entered and drove the market lower to Friday's lows of 5397 another HVN, from where the buyer emerged again.

Incidentally in profile we also consider a gap up as evidence of a buyer hand.

So we have a buyer at 5397 and a seller at 5465. It remains to be seen which side it resolves. It's two-all at the moment.


The other HVN of 10807 in the Bank Nifty played out again as it did on friday.

A perfect copy of the action of friday below 10807, with similar results.

This time we were not to be left out.

So this one is setting up as 10705-10807-10920.Either side 100 points to be made.

It remains to be seen if both the indices move up together.

Saturday, August 28, 2010

80 % there !

We had a real fast move in the markets yesterday in the afternoon session with big money and the longer time frame coming into the markets to take off 200 points in the BankNifty and 70 points in the Nifty in two hours flat.

Despite the early morning weakness, what stood out for me was the market's penchant to respect one of Market Profile's most famous rules-the 80 % rule.

In fact Profilers would say that market made that high just to respect that rule.

For the un-initiated in Market Profile, the rule states simply :

"If the market opens (or gets outside of the value area ) and then gets back into the value area for (2) consecutive 30 min bars the 80% rule states it has a high probability of completely filling the value area i.e it goes from value area low to value area high or vice-versa "

Let's look at the chart of yesterday :


Notice the high of the day is the value area high from day before.

I want to quickly take you back to last week's weekly report posted last Saturday here on the blog.You can find it here.

I'll re-post this chart from that post.


Based on that chart we called for an expiry above 5465 which incidentally happened.

Now I want you to apply the above rule ( 80 % rule) to this chart and see what happened.

Here's the chart of the Nifty future ( September values ) with that 80 % rule done.


Came from above value high and moved to value low, though I'll be the first to admit that I didn't think that it was possible to get that done in one day.

The 80 % rule is an 8 wins in 10 trades probability, a very good ratio, and a must to have in every trader's armory.

Looking ahead to the open on Monday, the AUD/ JPY our barometer for global sentiment at the close of NSE trading, didn't reflect the pessimism seen in the markets in the afternoon session.

We closed our conservative shorts at the closing bell on friday.

Wednesday, August 25, 2010

August Expiry

We are set up for a very interesting expiry this month, made all the more interesting by the big push lower in the last half an hour of the day.

Have a look :


What looked like a day where selling had been controlled at the 5465 HVN level, which stood out for the major part of the day, turned around for a close exactly there.

This is the first time in four days we saw selling into the close. The chart shows the big pullbacks developing in the second half of the day.

The Selling was even felt in the Bank Nifty which had it's first close below value area low and below the 10980 level we have been watching in several weeks.


Since tomorrow is expiry I want to quickly turn my attention to the action tomorrow, because tomorrow is the one day in the trading calendar when action gets dictated by open Interest and little of every thing else.

Let's look :


The IV range calculated by our Vix Calculator is 5518-5420 in the future and 5516-5409 in the spot.

By all accounts it will be volatile, as the PE writers sitting smug at 5500 PE will be facing the heat.I think many of them didn't anticipate this closing today and if they wilt tomorrow then 5420 will happen.The 65 lacs in OI at a current price of 37.45 will ensure that easily.

However if you look at the chart closely, then you will notice that despite two days of selling where we have seen the Nifty come down from 5540 levels to today's 5465, we have not seen a great reduction in the 5500 PE for September. In itself it tells us that the PE writers are confident that this downtrend will not continue.

However tomorrow it is not about September but about August.

I mentioned last month that the VIX formula by itself is nothing but a range.The key to the expiry is always in the Open Interest.

For tomorrow the key will be the 5500 PE.

If unwinding is seen then a short below our HVN at 5465 will be a safe bet.

Monday, August 23, 2010

EOD report-23rd Aug

We saw the volatility in the Bank Nifty first hand today, where a move below VAL for most of the morning session turned around to catapult the index back above value high by the afternoon.

Have a look:


The index ran in danger of closing below value low, buy a strong showing by ICICI Bank, SBI bank amongst others took it back up for a close yet again higher than previous value.

You just cannot short this index till it closes below value. The sellers are present but not aggressive enough and dare I say a bit mortified by the strength shown by buyers. We did another of the now common 100 point runs within minutes.Direction Up.

Nifty :


The chart shows the presence of a small seller in the 5535-5540 region.

He has managed to move down price by about 20 points in the past three days, but we feel that he may not be able to keep it for long.

We'll know tomorrow.

Saturday, August 21, 2010

Weekly Report

We are 4 sessions from expiry and nothing carries more attention this coming week than how expiry would play a role in the stock market fluctuations this coming week.

With open interest scaling new heights every expiry, there is no denying the large interest the expiry week holds for traders trading on the NSE.

Let's look at what the Nifty has done this month of August from the first trading day since July expiry.


The blue shaded region represents value area for this series.

As we can see that price is currently above value area, implying that buyers are strongly in control of this tape.

5467 represents developing value area high and 5433 the POC, both values which we have talked periodically for the past two months.

They will have a role to play in the future too. So remember them.

Based on the above chart, we are set to expire above 5467 levels.

We will look at this chart on Wednesday at the close.

Here's the bank Nifty :


This index confirms the action in the Nifty. Same inference. Watch the VAH & the POC.

Looking at the same chart from a weekly perspective, we get an idea of how strong this index has been.


Value has been building steadily higher.

The conservative trader will never attempt shorts above value area high. If you do want to short take a small position when value high is broken and add when value low breaks convincingly.

If it doesn't it best to reverse and go long and with the trend, as can be seen in the shaded regions.

To close let's look at the Nifty weekly:


Certainly not as strong as the Bank Nifty, but that large value area in that last week tells us the the longer time frame player is getting active in the index and we may see a move ( much of it happened already) after a lot of sideways action.

Enjoy your week-end.

Friday, August 20, 2010

EOD report for 20th Aug.

We had an inside day in the markets today with the Nifty and the Bank Nifty, holding on to the gains from day before.

This market has been strong since the break to the upside of the 5485 region which we had identified realer as a seller's zone.

Have a look at the charts :


The Nifty stayed well above value area low even today after a strong showing yesterday.

We have a bit of selling to overcome at 5535 before it moves up again to 5560-5585.

Value areas will be in play in the Nifty especially after the activity today.

Let's look at the BN.


A perfect inside day and the weakness of the afternoon was controlled near the 10980 region which was the point at which the big buyer showed up yesterday afternoon.

We've been discussing the strength in this index and the fact that there has been no weakness evident.A close below VAL will be the first sign of a fall in the daily or a trend change will be below 10800 levels, still 200 points below.

Till then it is a buy on dips.

I will put up some weekly charts over the weekend.

Wednesday, August 18, 2010

EOD report for 18th Aug.

Hello.

Let's begin by looking at the charts of the Nifty and the Bank Nifty future.


The Nifty had a slowish start to the day, but it was building up to the violent break out we would see in the afternoon.


The Bank Nifty broke below value high to move to value low, where it failed to attract a lot of selling. A move above VWAP was confirmation that the mini-downtrend had ended.

We used the quiteness of the morning session to share a couple of ideas on trading instruments. Shai did a good job in talking about moving averages and their role in trading.

Have a look at this chart :


The instrument we have chosen is SBI and the chart shows the impact of a 5-day moving average on it.Neither the instrument or the moving avaerage has impact on the study. The moving average can be 5, 10, 15, 50, 20, 70 ,1030 or any number the analysts come up with ( incidentally without any reasons).

The charts clearly show that the average lags price.Each turn of the moving average is 2 bars ( 2days) after price has moved.We never recommend the moving average for intra-trading because of this lag nature.

The lag can however be reduced slightly by moving to an EMA or DEMA or even TEMA.But the lag remains and it cannot be eliminated.

That's why in an intra-day set-up becuase of the lagging nature, it is not safe to base decisions on it.

So what is the solution?

Simple, add volume to the moving average through something called VWAP.

You don't expect me to talk about problems, without giving you solutions, do you?

Have a look at the same chart as the one posted above of SBI, this time with the VWAP.


You see how if you would have used VWAP, every turn of the market would have been addressed. The trend of the instrument and the indicator is up and VWAP would have kept you in the trade.

At Vtrender-2, we keep bringing you analysis which keeps you ahead of the curve.

Most of our trading mistakes emanate from the wrong things we pick up.If you can reduce mistakes in your trading, then you take that half a step forward to being a successful trader.

Tuesday, August 17, 2010

EOD report of 17th Aug

It's Viren, back with an EOD report of today's action.

It was a frustrating day of action for us in the markets, as there was no clear direction and a lot of whip-saws through the day.

Have a look.


The Nifty demonstrated it's respect for value areas by returning back from Value area low of the day ( purple dotted line). If you are not incorporating value areas in your trading methodology, then you are missing out on a few things.

The profile is balanced indicating a market on "hold".This market should resolve it's directional bias in the first session tomorrow.


Far from being a short, the Bank Nifty was strong through the day. A firm move above value high in the earlier part of the morning, ensured that shorts were at bay. This was not a day for sellers in this index.

For those who have been watching this blog for value areas, I want to stress that the purple lines on the charts represent value for tomorrow and they are Volume profile values as opposed to the price profile ones Shai has been putting up earlier.

We have done a few changes to the way we operate intra-day, and choosing volume profile has been one of them.

We plan to do a free webinar on the basics of Market Profile on our new platform, which supports audio and video.This webinar will take you through the basics of incorporating profile in your trading plan and the importance of it.

Keep an eye out for an announcement to that effect soon.

Even though we have launched a premium offering in Vtrender-2, our commitment to this blog and the larger role we want to play in promoting the market profile methodology remains the same as before.

So keep visiting n stay in touch.

Monday, August 16, 2010

EOD report for 16th Aug.

Hello there.

We had an extremely good day trading the markets with the volatility helping us to some good profits in our positional and intra day calls.

Let's have a look at the charts.


The market behaved a bit deceptively in the morning for us. It turned 0.15 paise from a short call in the morning, which didn't get initiated. We failed at a long at 5471 levels by 0.95 paise, but recovered with some fast profits on the downside.

The purple lines are the value areas for tomorrow and from the looks of it, promises to be very actionable again tomorrow.


We had some overnight shorts in the Bank Nifty from 10730 levels, which we closed around 10685 and 10699 for about 40 points of gain.

This index is still strong, looks short-able but not having the momentum in the short. Have to be careful trading this on the short side.

Sector wise, we had noted that the midcap IT space was short able for intra gains and we were loo0king at names like HCL tech and Financial Technology for some shorts.

We covered some easy ground with FinTech- Short at 1325, covered at 1312 in the future with a lot size of 250.

For tomorrow, 5398 and 5435 are our reference levels in the Nifty and 10675-10685 in the Bank Nifty.

Saturday, August 14, 2010

Emerging Markets

Viren here.

I was just doing a weekend check on global markets.

I want to share with you a chart I see often abour global induces.

These are global ETF's as they are traded on the NYSE, and tend to follow the individual stock markets of the countires they represent.

For example IFN is an ETF which is a deriavtive of the Nifty, not as good as the Nifty Bees, but close enough. FXI would be that for China and EWZ for Brazil.


You can enlarge the chart by a right click on it.

India, Thailand, Malaysia are showing a similar trend.

Have a look at the MSCI HongKong index which we track close to our open:


But each of these indices are showing a realtive strength when compared to an index like the SPX or DOW or even their European counterparts.

We have done a lot of corelation studies on this blog before.Refer to this and this

We will keeping following the trends in South East Asia for a definitive edge to our trading.

Thursday, August 12, 2010

EOD 12th Aug

Hello all.

I'm back with my EOD update.

Have a look at the charts from today.

First the Nifty.


We were aware at the close yesterday that sellers were covering their positions. Those who didn't did so in the morning. However we were waiting for a confirmation at the open itself for the same. Within a few minutes of the open, we saw the sellers covering and responsive buyers emerge. We were looking for longs and took one near 5386 for 5404, which was achieved.

Next up we looked at the Bank Nifty.


We took a safe long at value area low for a target of value area high.

We reached our price objective in about 17 mins.We also attempted a short later, but bailed out at cost with our stop being saved by 10 paise and the trade having shown us a potential 20 point gain.

The point is that the charts show how easy it is using profile to identify events in the day and take advantage of them as they happen.

With an open below value and outside of range today, we knew that it was going to be a large range day and the same happened today.

Market profile keeps you ahead of the curve.Proud to be a profiler.

Wednesday, August 11, 2010

EOD 11th Aug

Viren here.

It was a fascinating day of trade in the markets today.

Let me add...for the sellers.

Those who sold at the open and held came back with good rewards.


The Nifty was resisted in the morning again at value high and the sell was confirmed below value low.


The Bank Nifty started as the weak index today, reversed higher but weakened again at the close helped a lot by the downmove in SBI today.

We took two trades today.

One short in the Bank Nifty in the early morning and another short in the Nifty in the afternoon.Both high probability trade set-ups.Both went on to hit their price objective.

Looking ahead to tomorrow, the market looks like it is preparing itself for a sharp fall in the US markets tonight. I won't be surprised if it does not react to a fall there tonight at the open tomorrow, or auctions higher at the open.

Vtrender 2 has started off on a good note and we were happy to see smiling faces in the trading room.

Tuesday, August 10, 2010

Chart Reading.

Viren here.

If you have been tearing your hair off in this sideways market, I would not blame you.

The market has been listless, moving randomly without a sense of direction.We have put in a 100 point range for a month now.

I want to call on all those people who tell you that "A trend is your friend". What happens when we do not have a trend? Fact is that 70% of the time the markets do not trend.In market profile we call this a bracket.

In any timeframe you see, the market this year has been in a bracket. Brackets are the easiest markets to trade if you know clearly your entries and exits.

As Shai says often, these markets are not boring, they are predictable.

Let's look at what the Volume profile chart says for yesterday's and today's action:


We saw the 80 % rule at play yesterday. It fetched us an easy 22 points per lot.

Today, in the morning the market was in no mood to get over Value area high. See the three red arrows on the right side of the chart.Once the market broke through Vwap, the short was confirmed to hit value area low for a 16 point trade.

In 2 days, bread and butter value area set-ups were good to fetch you 38 points per lot in a market which moved 54 points in two days.

In both the above setups the risk was a meager 5 points, if it had refused to move above value low yesterday and went above value high today and the reward was more that 1:3, actually 1:4 yesterday and 1:3 today.

Market profile throws at least one good set-up everyday around value areas.Besides value areas, high volume nodes also give you low risk/ high reward entry points. I plan my trade around value areas generally and Shai does it around high volume nodes.

Rules like the 80% rule in Market profile have a 2 in 10 chance of failing, or in other words they are right 8 out of 10 times.

There are many more set-ups in Market Profile and we will bring all of them to you in Vtrender 2.

We are starting Vtrender 2 from tomorrow. The details are here : http://vtrender.blogspot.com/2010/07/vtrender-2.html.

We want to enable all of you to locate these set-ups all by yourselves.For too long you have depended on subscriptions, forums, blogs and blog masters etc for your trading ideas.

Vtrender 2 will set you free. If you have to visit these places again, you will visit not to take direction, but to confirm it.

Estimates for 10th Aug

Good Morning All.

We had a good session of trade yesterday. Have a look at the charts as they stood yesterday EOD.

First the Bank Nifty.


We were watching for sellers to be active in the index 'cos of the P shaped profile on the weekly developed over the weekend.

We were also watching value areas to see who would establish control. The post over the weekend can be referred to here.

Certainly the BNF was very strong on Monday. It moved swifty over value high and continued upwards to 10500.I've noticed a pattern of up/down values in the chart marked by the numbers. If the pattern plays out again, then value should be established lower again today.

10473 is the ref line for the BNF today.

Let's look at the Nifty now.


Again up/down values.

5486 at the top and 5459 below are ref lines.

Have a good day.

Monday, August 9, 2010

Estimates for 9th aug

Good Morning All.

Values for the Nifty are 5451-5462-5473

Values for the Bank Nifty are 10395-10441-10458.

It will be interesting to see if Nifty auctions above value low at 5451.

Saturday, August 7, 2010

Vtrender 2

Vtrender Live will have a new platform for all of us and an ability to carry audio and video.This will be an interactive trading room where we can interact live.

Our offering is subdivided into two parts :

Vtrender Mornings
:This will be a 60 minute presentation.Here we will review the open and see what kind of a day we can expect and the range movement.I plan to project my charts to you and mark out important reference points for us to take action when needed. Here we will also look at swing trading candidates, review existing positions and short list a watch list for the next few days.

Vtrender Afternoon : This will start at 2.45 and go to the close. This is a post-mortem of the day's activity, important for signs of continuity or change.

During the day, we will be available in the trading room where we can take your messages or give inputs on the emerging market action.

The audio will be only for the two sessions mentioned above and can be muted should you desire.

My trading screen will be live throughout the day.

Subscribers will be given access to the new Vtrender Live site which will have updates.

We also plan to provide sms updates on all the calls.

Subscription to Vtrender2 is INR 3999/- only.To the right of the screen, is the 'subscribe' option which you can use to pay by paypal, credit or debit cards.

If you wish to transfer money online from your account, then please send a mail to Vtrender@gmail.com, and we will guide you on the procedures.

After you subscribe please send us your name and contact details with a confirmation copy of the transaction and we will mail you the set-up details.

All other correspondence or queries to be sent to Vtrender@gmail.com.

Weekly charts

We finished a very dull week of trading, with sideways 15 point moves through most of the week, followed by a violent 20-30 points to finish the day.

Let's look at what the charts are saying :

First the Bank Nifty.

This has been a chart as strong as any you could look at, repeatedly frustrating sellers during the week. I mentioned that on friday, value was being shifted lower in the daily. Have a look at what the weekly of the Bank Nifty Future is telling :


We are noticing signs of long liquidation at the top, evident in the P shaped profile. Whilst this does not necessarily mean that the index will drop like a rock, it certainly points to the buying momentum waning. Now it is upto the sellers to step in to move it lower. If that happens look for 10280 and 10150 to be targeted during the week.

We'll watch for signs on Monday, whether that happens.The first tell will be an auction or a failure of an auction above Friday's value high / value low.

Let's look at the weekly chart of the Nifty Future.


This was a very dull week with sideways action as evident in the value which was within last weeks'.

The immediate supports are in the 5390-5405 region. Higher up a close above 5465 was not maintained for the daily momentum to go up. Besides 5465, the other reference level is 5485 in the hourly.

Hopefully, moving away from the value areas either side, should bring momentum to the index, something which has been missing all through the week.

Let's also have a look at the weekly $spx spot prices.


In the future we had mentioned earlier how the 1096 level and the 1129 levels are important reference levels. Failure to auction above 1129 future unleashed some pent-up selling pressure on friday.

The chart still projects long liquidations near the top at 1129 odd levels.

It will be interesting to see if 1090-1100 on the spot can hold.

Friday, August 6, 2010

Estimates for 6th aug

The market has opened below value and bear the outer end of the range from yesterday.

5463-5471-5476 are the values for the Nifty.

10448-10465-10483 are the values for the BN.

The 80 % rule says that if we open below value, then 80% of the time we will go to hit value high, if we enter value low and auction above it for a minimum of 31 mins.

---

Thursday, August 5, 2010

Estimates for 5th aug

Good Morning all.

Markets have opened above value and at the top of their range of yesterday.

Value high at 5442 should serve as a support ( if reached) and 5485 is a ref level to watch for hourly momentum.

Globally, we are watching copper move higher and the yen lower to further document risk acceptance in equities. Catch viren's post here for more details.

It's been a dip buyer's environment for the past three months, with yesterday's grind and bump up in the close giving further evidence.

On the BN watch if 10420 holds for further up moves.

Values : 5443-5433-5424 in the Nifty and 10419-10397-10376 in the BN.

---

Chart of AUD/ JPY from last week :

Viren had posted this chart over the weekend. Here is the updated chart as of Now.


Notice the sharp rise at 2.20 IST yesterday.
Does it ring a bell?
All major markets closed up yesterday

----

13.35

yes it is very stock specific action.

It's a pity we lost out on ACC, but the stock looks to be balancing and ready to run higher.

Bharat forge is another one ready to run.

SBI, tata motors, hcl tech, infy great stories.

Activity in IT sector. Energy holding on.

It's a market of stocks..

---

Wednesday, August 4, 2010

EOD 4th Aug

Viren here.


"It was a lacklustre day of trading yesterday and early signs off the open this morning calls for another dull morning of trade at-least in the first half.
Coming back to today's trade, let's look at an auction above yesterday 5443 to chase longs. Shorts have been ineffective, so we stay with the dominant trend which is actually side-ways, but borderline up."

Where did you read this in the morning--Go figure.

2 days of a failure to move below 5419 made a move up a possibility.It's a tape which wanted to go down, but could not find the resources to do it.

Value though has not moved up a lot, so again you know it is the frustrated shorts who covered. I'll like to see 5443-5447 being tested again tomorrow.

..And the BN.


Auctioned below Value low all the way to yesterday's lows like the Nifty.It took the entire day to get to the lows, but launched up to the highs again in 90 minutes. That's always an indication of a strong index, with buyers calling the shots.

But overall value is still lower, so there is supply overhead.Let's see how it responds to value tomorrow at the open.

Estimates for 4th aug

It was a lacklustre day of trading yesterday and early signs off the open this morning calls for another dull morning of trade at-least in the first half.

I've been doing a lot of background research for Vtrender2, particularly for our swing trading and positional requirements. I've noticed that Financials have been strong and the energy sector is a dip buy candidate. We have already taken a position in Reliance.

We'll carry this theme of sector rotation in Vtrender2, where within the sector, we look at the best candidate to take our position forward.So we get a win out of money moving in the sector as well as our technical analysis of the stock in that sector.

Vtrender 2 will be live from Monday-9th August and the subscription link will be on tonight.

Coming back to today's trade, let's look at an auction above yesterday 5443 to chase longs. Shorts have been ineffective, so we stay with the dominant trend which is actually side-ways, but borderline up.

Trade smart and quick.

---

Tuesday, August 3, 2010

Estimates for 3rd aug

The markets have opened flat and around the 5435 levels.

Value area rule may come into play today.

5429-5419-5411 are the value areas. Watch to see if market stays above 5429-5435.

The values for the BN are 10343-10292-10240.

Shorts are right only below 10343.

---------------

Monday, August 2, 2010

Estimates for 2nd aug

Good Morning All.

Markets have opened the new moth of August near value high from friday.

5407-5398-5388 are the value areas and if we see an auction above 5407, then 5420 and 5435 become immediate targets.

10185-10159-10134 are the value areas for the bank nifty. It is incidentally well above 10210 which was a ref level.The inside day on friday also pointed to a large move in the BN today. Use value high at 10185 to manage risk on the index.

---

Sunday, August 1, 2010

Swing trading with Market profile

We've talked a lot on this blog on market profile with day trade set-ups.Today let's look at what the buyer and the seller are doing in the short term as well as the intermediate term.

Here's a chart of the Nifty Future on a monthly time frame, rather an expiry to expiry view.


The first thing which strikes you from the chart is that value moved strongly upwards from the last expiry in June.The blue shaded regions are the value areas.

When value moves up, it indicates that buyers are in control in that TF.So monthly trend is still up.

Let's look closely at the three points mentioned : 1,2 and 3

This control by the buyers will be given up slightly, if point 1 on the chart is lost on EOD basis. Point 1 is the POC of the last expiry at 5379 coinciding with value high of April expiry at 5364. So break of 5364-5379 alerts you if you are long.

Now point 2 is defined by the value low of last series as well as POC from April.A break below point 2 on EOD basis means that sellers have started exhibiting control.So point 2 becomes a reference line, if you want to start taking safe short positions.Point 2 is 5308-5298.

Lower down is point 3, or upper value area of the expiry in April and May.Point 3 is 5222-5190. A break of point 3 puts the market safely down for a possible 100 points and even 200 to value low.

Now let's evaluate what we know on a smaller TF- the weekly.

Here is a weekly chart :


The chart is for the past three weeks. Value is moving up ever so slightly.5366 and 5371 are the value lows for the past two weeks.Even the weekly points to a break of 5366 as ringing alarm bells for buyers.A move above 5425-5437 will change the mode back to buying.5463 also value high will bring momentum back for the buyers.

Weekly charts and monthly charts tell you the same thing we have been knowing all along.Remember 5367 and 5466. :) .

Now these points are a blue print for you, for your swing trades, but the most important information in the market is the current one. So you have to constantly weigh if the current market action is going as per your plan. Remember, the past is a place for reference, not for residence. So take action.!