Showing posts with label OrderFlow. Show all posts
Wednesday, August 17, 2011
Auction Market theory on Orderflow
In my previous post on OrderFlow, I spoke on the importance of buyer and seller activity in the movement of the markets. Logic dictates that the market will continue going up till there are more buyers than sellers and will start going down when sellers overpower buyers within the day.
Hence the proper trade would be to be with buyers when they are long and with sellers when they are short. Anything other wise will put your bias on the opposite side of the market, not really a healthy situation for our accounts.
This is also called Auction market theory. 99 % percent of individual retail traders, do not have a clue of how this principle works and get whipped around in the markets especially in intra day trading.
Order Flow helps us to level the playing field against large institutional desks, hedge funds, high frequency traders and their like by spotting their presence , actions and intentions.
I maintain again, tracking supply and demand, measuring the actual buying and selling transactions of the market is the single best predictor of future prices, therefore using order flow is the best path to consistent profits in trading.
I leave you with today's Nifty charts :
Friday, August 5, 2011
Today's Copper OrderFlow
Here is the OrderFlow chart of Copper Futures.
Most of you would know that a strong copper equals strong equities and they move the same direction or are directly proportional more times than not.
The US jobs number seems to have a positive spin on the US futures which are at 1214 currently. But much before all that happened, copper delivered a buy signal at 3.15 pm.In other words, risk appetite was returning to equities.
The signal has already generated + 4 points and strength above 417 would give more.
Most of you would know that a strong copper equals strong equities and they move the same direction or are directly proportional more times than not.
The US jobs number seems to have a positive spin on the US futures which are at 1214 currently. But much before all that happened, copper delivered a buy signal at 3.15 pm.In other words, risk appetite was returning to equities.
The signal has already generated + 4 points and strength above 417 would give more.
Thursday, August 4, 2011
Order Flow revisited
Our basis for measuring supply and demand in the market place is to see where the market participants themselves, are making buying and selling decisions at the intra day and swing trade levels.
Market participants cover the entire gamut of traders from retail to institutions.
It makes an awful lot of sense to me to buy when there are more buyers than sellers in the market place and sell when there are more sellers than buyers.
Accordingly the Orderflow turns red when we have more sellers in the market and blue when we have more buyers.At such points, a mental note of the levels at which the seller appears or the buyer is showing up, makes a lot of sense.
Here is the OrderFlow from today;
Nifty :
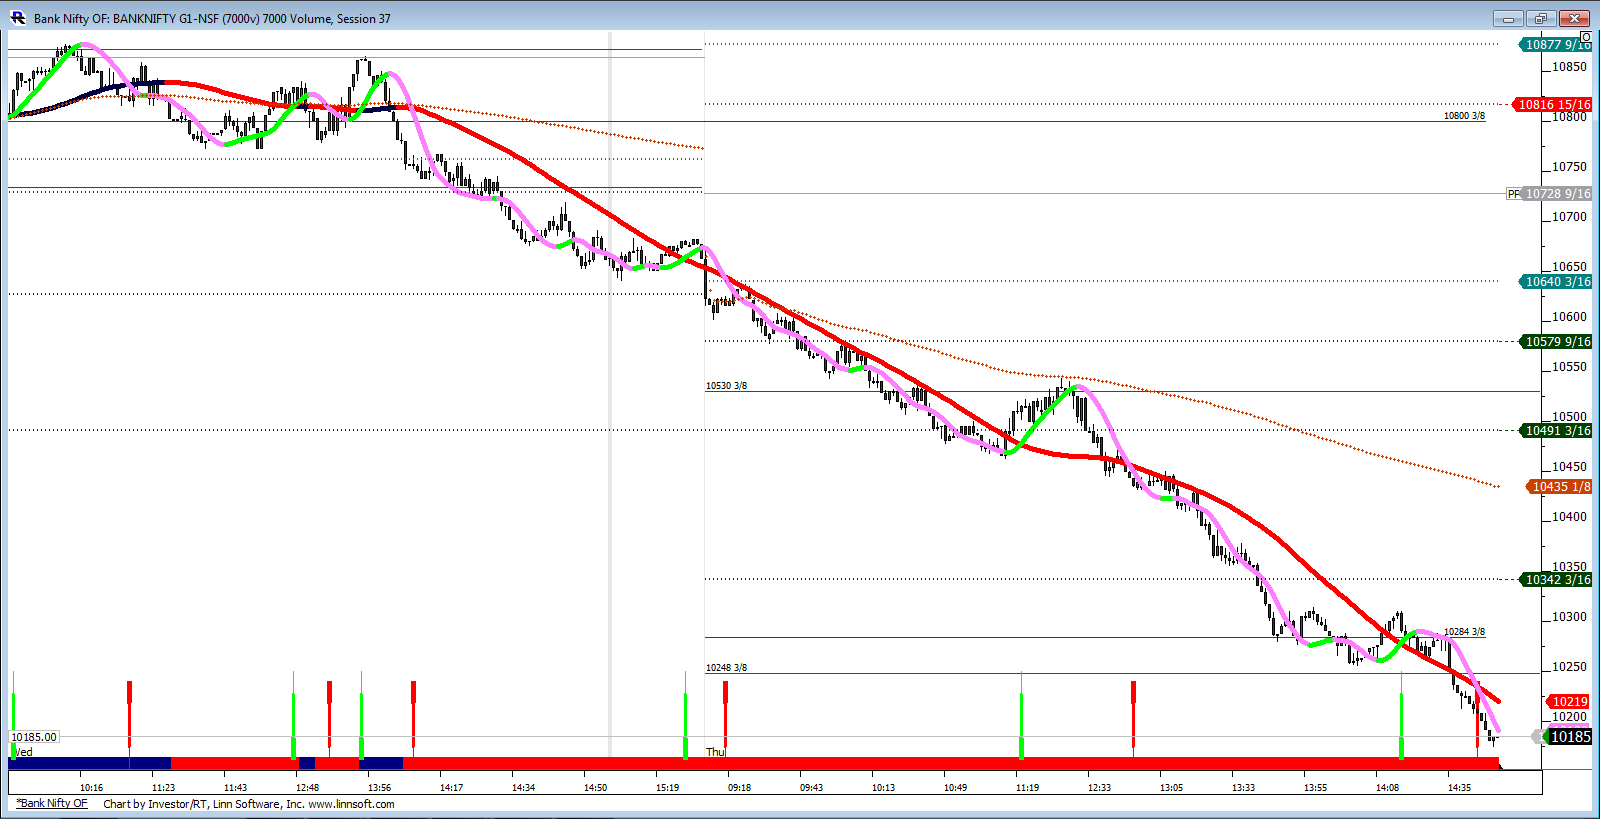
BankNifty :
The most unique part of these charts is that it puts you on the right part as far as your bias is concerned.
A further confirmation is from our unique pivot point system which we call Prime levels.This is the Pivot point system, re-invented, where instead of the traditional use of price, we use a mixture of price + volume to get our levels right. These are represented on charts as PR3 to PS3 with day PP0 deciding the bias for the day.A market is strong above PP0 and weak below it.
Order flow always tells you the buying/ selling of the market.
Trade the Flow !
Market participants cover the entire gamut of traders from retail to institutions.
It makes an awful lot of sense to me to buy when there are more buyers than sellers in the market place and sell when there are more sellers than buyers.
Accordingly the Orderflow turns red when we have more sellers in the market and blue when we have more buyers.At such points, a mental note of the levels at which the seller appears or the buyer is showing up, makes a lot of sense.
Here is the OrderFlow from today;
Nifty :
BankNifty :
The most unique part of these charts is that it puts you on the right part as far as your bias is concerned.
A further confirmation is from our unique pivot point system which we call Prime levels.This is the Pivot point system, re-invented, where instead of the traditional use of price, we use a mixture of price + volume to get our levels right. These are represented on charts as PR3 to PS3 with day PP0 deciding the bias for the day.A market is strong above PP0 and weak below it.
Order flow always tells you the buying/ selling of the market.
Trade the Flow !
Thursday, July 14, 2011
Nifty OrderFlow for today
Attached is the Order flow chart for the Nifty July future.
The big volatile day of today was caught by the Orderflow which gave us a sell at the open, a buy at 11.04 when the Nifty was at 5576 and a sell again at 2.48 pm when the Nifty was at 5646.
We have also introduced Prime levels on the charts which tell us to book an existing position. Thus a long position has to be booked near PR1/ PR2 or PR3. Conversely a short has to be booked near PS1/ PS2/ PS3.The days highs were at PR3 and the lows near PS2.
These levels are derived from the PP0 level which is Prime Point Zero or a neutral point for the day. A market's bias is negative below PP0 and positive above it.
The prime levels are a better way to interpret the market action just like the Pivot point system, but unlike the pivots which run on price only, the prime levels operate on price and volume and are better indicators to day action.
The big volatile day of today was caught by the Orderflow which gave us a sell at the open, a buy at 11.04 when the Nifty was at 5576 and a sell again at 2.48 pm when the Nifty was at 5646.
We have also introduced Prime levels on the charts which tell us to book an existing position. Thus a long position has to be booked near PR1/ PR2 or PR3. Conversely a short has to be booked near PS1/ PS2/ PS3.The days highs were at PR3 and the lows near PS2.
These levels are derived from the PP0 level which is Prime Point Zero or a neutral point for the day. A market's bias is negative below PP0 and positive above it.
The prime levels are a better way to interpret the market action just like the Pivot point system, but unlike the pivots which run on price only, the prime levels operate on price and volume and are better indicators to day action.
Friday, June 10, 2011
OrderFlow from Today
A quite day turned volatile into the close
Most of the session showed the complete absence of buyers in propping up a dull market and the market continued to drift lower before some aggressive shorting and covering late into the day, brought some excitement to the day's proceedings.
Here are the OrderFlow charts for Nifty :
Sellers were in control since morning as OF was red all through Shorts started covering at day PS3.
BankNifty :
OrderFlow shorts triggered at 10750. Shorts covered near day PS3.
ICICI :
Shorts again covered near day PS3.
Most of the session showed the complete absence of buyers in propping up a dull market and the market continued to drift lower before some aggressive shorting and covering late into the day, brought some excitement to the day's proceedings.
Here are the OrderFlow charts for Nifty :
Sellers were in control since morning as OF was red all through Shorts started covering at day PS3.
BankNifty :
OrderFlow shorts triggered at 10750. Shorts covered near day PS3.
ICICI :
Shorts again covered near day PS3.
Tuesday, June 7, 2011
New OrderFlow
In our trading room we have introduced signals for our orderflow indicators as well as levels to decide part booking or exiting an established position.
Check the buy call in BN at 10712 yesterday
Based on our intra day "power levels" we have set alerts to exit the holding at 10917 or 10994 BNF based on the message coming from orderflow at that time.
Check the buy call in BN at 10712 yesterday
Based on our intra day "power levels" we have set alerts to exit the holding at 10917 or 10994 BNF based on the message coming from orderflow at that time.
Friday, May 6, 2011
Profile charts for 6th May
All Passwords to the Open house have been issued. If you have not received one, please send me a mail at vtrender@gmail.com.
Tonight I will put out our pre-market analysis to all, especially to help our visitors understand the markets better in the trading room tomorrow.
At Vtrender, we are firm believers of " Planning the trade- Trading the plan". This we do through two steps :
a) A pre-market study of important levels, published every night on all 5 instruments we track.
b) Our order flow indicators which give us conviction for our trades when we execute them.
One of our readers Rajeev mentioned some time back here, that your success in trading worked to a formula he gave as :
Successful results in trading = your market understanding x ( you + trading strategy).
Had trading not involved money, our emotional natures of greed and fear wouldn't have interfered and we would have got 10 out of 10 trades right, when our market understanding was 10/10.But every good trader will tell you that there is substantial difference in paper trading and putting actual money to work. It's always the "you" which makes a difference to our trading accounts and hopefully with the pre-market study and the orderflow indicators we have tried to eliminate as much fear as possible and control greed.It just helps us to take profits and execute stops better.
Now for tomorrow's action .
The content below is copied from Vtrender Live.
------------------------------------------------------------------------------
Profile charts for 6th May
Today's updated comments are displayed in bold. Comments from yesterday and the previous days are above the bold print.
Broader market of Thursday: A quite consolidation within the initial balance turned into a selling frenzy.The range extension lower was accepted and the market closed at the lows.
Bank Nifty Futures :
- single prints at 12020 at the top.
- 11580 had the largest volumes and the region of 11580/ 11625 will resist all up moves
- 11116 is pull back high and important level for future ref.
- a NV day with close at POC
- 10864 is VAL and support
- 10815 and 10777/ 10745 are possible below val tomorrow.
-----------
- dpoc at 10800
- 10707 is support for tomorrow.
- 10621 and 10534 are projected estimates below 10707.
- resistance to upmoves will be 10794 and then 10909
- 11108 and 11306 are possible if it stays above 10909
Nifty Futures :
- single print selling from 5930 again today
- Large volumes at 5760 and 5794
-5666/76 is pull back high and single prints and resistance for any up moves
---------
- single print selling from 5593
- below 5409, 5465 and 5420 possible.
- resistance again at 5597 and 5641.
- 5565 again a ref level to the upside
------------
- single prints at 5520-5493 in the middle of the DD
- VPOC at 5460
- 5406 and 5371 are projections for a lower auction
- 5510 will resist all upmoves
- 5585 possible on auction above 5539
SBI Futures :
- Large volumes visible below prev support of 2850
- support expected between 2580-90 which are HVN's
---
- SBI had an inside day
- play break of value and range for good profits.
- 2634-2614-2606 are the value areas
- 2655 and 2681 are levels on upside
-2575 on breakdown below VAL
RIL :
- RIL continues to be weak below 1005.
- RIL formed an inside day around HVN of 976.
- region of 929-35 to provide support after the poor lows seen at 940
--------------
- RIL will continue to get resisted at 971-978
- poor highs at 964 has to be repaired
- single print buyers at open for second day today
LT Futures :
----
- poor lows at 1528 would call for a revisit there below VAL
- 1516 possible below 1528.
-------
- LT ran into resistance at 1574
- Below 1526 can see 1507/ 1487
- move above 1545 can take it to 1569 and then 1590
---------------------------------------
- Please note all above levels and use OrderFlow to execute trades in the trading room.Details on the OrderFlow indicators are under the column titled OrderFlow to the right of the blog.
Tonight I will put out our pre-market analysis to all, especially to help our visitors understand the markets better in the trading room tomorrow.
At Vtrender, we are firm believers of " Planning the trade- Trading the plan". This we do through two steps :
a) A pre-market study of important levels, published every night on all 5 instruments we track.
b) Our order flow indicators which give us conviction for our trades when we execute them.
One of our readers Rajeev mentioned some time back here, that your success in trading worked to a formula he gave as :
Successful results in trading = your market understanding x ( you + trading strategy).
Had trading not involved money, our emotional natures of greed and fear wouldn't have interfered and we would have got 10 out of 10 trades right, when our market understanding was 10/10.But every good trader will tell you that there is substantial difference in paper trading and putting actual money to work. It's always the "you" which makes a difference to our trading accounts and hopefully with the pre-market study and the orderflow indicators we have tried to eliminate as much fear as possible and control greed.It just helps us to take profits and execute stops better.
Now for tomorrow's action .
The content below is copied from Vtrender Live.
------------------------------------------------------------------------------
Profile charts for 6th May
Today's updated comments are displayed in bold. Comments from yesterday and the previous days are above the bold print.
Broader market of Thursday: A quite consolidation within the initial balance turned into a selling frenzy.The range extension lower was accepted and the market closed at the lows.
Bank Nifty Futures :
- single prints at 12020 at the top.
- 11580 had the largest volumes and the region of 11580/ 11625 will resist all up moves
- 11116 is pull back high and important level for future ref.
- a NV day with close at POC
- 10864 is VAL and support
- 10815 and 10777/ 10745 are possible below val tomorrow.
-----------
- dpoc at 10800
- 10707 is support for tomorrow.
- 10621 and 10534 are projected estimates below 10707.
- resistance to upmoves will be 10794 and then 10909
- 11108 and 11306 are possible if it stays above 10909
Nifty Futures :
- single print selling from 5930 again today
- Large volumes at 5760 and 5794
-5666/76 is pull back high and single prints and resistance for any up moves
---------
- single print selling from 5593
- below 5409, 5465 and 5420 possible.
- resistance again at 5597 and 5641.
- 5565 again a ref level to the upside
------------
- single prints at 5520-5493 in the middle of the DD
- VPOC at 5460
- 5406 and 5371 are projections for a lower auction
- 5510 will resist all upmoves
- 5585 possible on auction above 5539
SBI Futures :
- Large volumes visible below prev support of 2850
- support expected between 2580-90 which are HVN's
---
- SBI had an inside day
- play break of value and range for good profits.
- 2634-2614-2606 are the value areas
- 2655 and 2681 are levels on upside
-2575 on breakdown below VAL
RIL :
- RIL continues to be weak below 1005.
- RIL formed an inside day around HVN of 976.
- region of 929-35 to provide support after the poor lows seen at 940
--------------
- RIL will continue to get resisted at 971-978
- poor highs at 964 has to be repaired
- single print buyers at open for second day today
LT Futures :
----
- poor lows at 1528 would call for a revisit there below VAL
- 1516 possible below 1528.
-------
- LT ran into resistance at 1574
- Below 1526 can see 1507/ 1487
- move above 1545 can take it to 1569 and then 1590
---------------------------------------
- Please note all above levels and use OrderFlow to execute trades in the trading room.Details on the OrderFlow indicators are under the column titled OrderFlow to the right of the blog.
Friday, April 15, 2011
OrderFlow at 1.00 pm.
In Market profile, the auction theory is all about the buying and the selling of the market.
Fortunately in our trading room, we keep a record of this through our OrderFlow indicators.
The orderflow measures the buying and selling of the market and puts us ahead of some great trades through it's uniqueness.
It is based on the actual money chasing longs/ shorts and always a good window on where the market is selling off and where it is buying into.
On Wednesday, the buying in the market was depicted through a blue streaming line ( blue is for buying and red for selling) and this morning we had a red orderflow straight off the open.
Today the buying has been less, evident in the lesser blue in today's charts compared to the one on wednesday which was all blue until the close.
Fortunately in our trading room, we keep a record of this through our OrderFlow indicators.
The orderflow measures the buying and selling of the market and puts us ahead of some great trades through it's uniqueness.
It is based on the actual money chasing longs/ shorts and always a good window on where the market is selling off and where it is buying into.
On Wednesday, the buying in the market was depicted through a blue streaming line ( blue is for buying and red for selling) and this morning we had a red orderflow straight off the open.
Today the buying has been less, evident in the lesser blue in today's charts compared to the one on wednesday which was all blue until the close.
Friday, March 11, 2011
Thursday, February 24, 2011
Bank Nifty Trading
Here's some analysis about the bank Nifty posted at Vtrender-2 :
- The poor lows created around 10800(-40) gave way today.
- Positions can be carried below 10616 for 10165 with a closing stop at 10830 for a 450 point move.
-Only 10400 is a minor support below 10616
And here is the OrderFlow confirmation for the same.

When Order Flow and profile analysis matchup, nothing stands in the way !
- The poor lows created around 10800(-40) gave way today.
- Positions can be carried below 10616 for 10165 with a closing stop at 10830 for a 450 point move.
-Only 10400 is a minor support below 10616
And here is the OrderFlow confirmation for the same.

When Order Flow and profile analysis matchup, nothing stands in the way !
Tuesday, February 22, 2011
OrderFlow
After two days of activity, the Nifty Future has managed to close at exactly the developing point of control and today's lows were exactly at the VWAP for the series.
Viren's charts posted over the weekend haven't changed much and neither has been the assessment for the series.
During such times it is better to sit back and let the action unfold through pre-determined levels ( Value areas suggested by him) than alternate between buying and selling views for every 40 point move the index makes.
Speaking of taking views on buying and selling, our OrderFlow indicators continue to amaze us with their accuracy even in these side-ways markets.
As a trader, you only want to be on the right side of the days trend and whilst you may not be able to capture every rupee from the markets, our OrderFlow indicators at least help us to decide which side to lean on for our trades.
It's a strict "No" to trade opposite the main trend as indicated by the OrderFlow Red-Blue.
Have a look :

The Order Flow captures all the moves of the market and occasionally when it goes side-ways, it tells us to lie low or trade less aggressively than we normally do.
You don't need great technical analysis to know which side to trade on. Short when OF is red and Long when OF is Blue.The two reversals (blue OF) at 10.00 am and 3.00 pm with each measuring 40 points tell us clearly when the trend is changing and are a warning to book existing profits if not to reverse the trade.
Here's the bank nifty :

It's great to see such a volatile instrument being tamed to such perfect signals by the OrderFlow indicators. 6 signals in 2 days and each measures over 80 points at the minimum.
You just require two things to trade the OrderFlow :
1) belief in the method ( we have put all the thinking in the indicator)
2) patience.
with these two things, you will surely "kick the habit of losing money in the markets"
Viren's charts posted over the weekend haven't changed much and neither has been the assessment for the series.
During such times it is better to sit back and let the action unfold through pre-determined levels ( Value areas suggested by him) than alternate between buying and selling views for every 40 point move the index makes.
Speaking of taking views on buying and selling, our OrderFlow indicators continue to amaze us with their accuracy even in these side-ways markets.
As a trader, you only want to be on the right side of the days trend and whilst you may not be able to capture every rupee from the markets, our OrderFlow indicators at least help us to decide which side to lean on for our trades.
It's a strict "No" to trade opposite the main trend as indicated by the OrderFlow Red-Blue.
Have a look :

The Order Flow captures all the moves of the market and occasionally when it goes side-ways, it tells us to lie low or trade less aggressively than we normally do.
You don't need great technical analysis to know which side to trade on. Short when OF is red and Long when OF is Blue.The two reversals (blue OF) at 10.00 am and 3.00 pm with each measuring 40 points tell us clearly when the trend is changing and are a warning to book existing profits if not to reverse the trade.
Here's the bank nifty :

It's great to see such a volatile instrument being tamed to such perfect signals by the OrderFlow indicators. 6 signals in 2 days and each measures over 80 points at the minimum.
You just require two things to trade the OrderFlow :
1) belief in the method ( we have put all the thinking in the indicator)
2) patience.
with these two things, you will surely "kick the habit of losing money in the markets"
Saturday, February 5, 2011
OrderFlow SBIN & RELIANCE
Here are the OrderFlow charts for SBI and Reliance futures.
Over the week, we did some tweaking with our code and the final result is produced below.
SBI :

Reliance :

An adamant pixels/bar in the platform prevents me from displaying more data than this on screen.
It was interesting to note that the sell-off from 5560 levels was matched in all the 4 orderflow charts yesterday.
Over the week, we did some tweaking with our code and the final result is produced below.
SBI :

Reliance :

An adamant pixels/bar in the platform prevents me from displaying more data than this on screen.
It was interesting to note that the sell-off from 5560 levels was matched in all the 4 orderflow charts yesterday.
Tuesday, February 1, 2011
Seller Strikes Back !
Monday, January 31, 2011
Bounce
Heading into the open of today, we had a 3I day as a background.
The early morning inventory was short and the market wasted little time in getting near the level of 5435 mentioned in the weekend post.Incidentally the low of today (5438) was last seen on the 1st of September last year.
Once the seller was neutralized, the only message from the market we were looking at was strength above 5484 and movement at the previous day's Point of Control.

There was responsive selling at the POC, but further buying later in the session turned it into a profitable day for the bulls.
Tomorrow morning the market will look for 5504 to protect the buying after which we can once again see 5549 and then 5580 and hopefully the big 5625.
In the BankNifty the poor lows mentioned at 10530 were broken to the downside and the lows from 14/ 1 and 17/ 1 were re-visited before the BankNiftyy made a reversal and closed higher at 10660.

Strength above 10740-10760 will put a revisit of 10900 back on the cards.
The early morning inventory was short and the market wasted little time in getting near the level of 5435 mentioned in the weekend post.Incidentally the low of today (5438) was last seen on the 1st of September last year.
Once the seller was neutralized, the only message from the market we were looking at was strength above 5484 and movement at the previous day's Point of Control.

There was responsive selling at the POC, but further buying later in the session turned it into a profitable day for the bulls.
Tomorrow morning the market will look for 5504 to protect the buying after which we can once again see 5549 and then 5580 and hopefully the big 5625.
In the BankNifty the poor lows mentioned at 10530 were broken to the downside and the lows from 14/ 1 and 17/ 1 were re-visited before the BankNiftyy made a reversal and closed higher at 10660.

Strength above 10740-10760 will put a revisit of 10900 back on the cards.
Saturday, January 22, 2011
OrderFlow
I got a mail from an individual comparing the performance of these indicators to something he has devised claiming his method to be superior.
Incidentally he refused to divulge more info other than the superiority factor.
I wish him and all other individuals the best, if they have something better to help them improve their trading. It was never our claim that we have found the "holy grail of trading" or the best system of trading known to mankind.Neither are we in competition with anybody else for a performance ranking.
Our orderflow indicators are trend indicators in 2 time frames for intra-day and help us to make proper decisions to buy/ sell or exit as the market keeps churning out new information.
As regards to the Holy Grail- everyone has one- the one between your ears, provided you know how to use it wisely.
Nifty :

Bank Nifty :
Incidentally he refused to divulge more info other than the superiority factor.
I wish him and all other individuals the best, if they have something better to help them improve their trading. It was never our claim that we have found the "holy grail of trading" or the best system of trading known to mankind.Neither are we in competition with anybody else for a performance ranking.
Our orderflow indicators are trend indicators in 2 time frames for intra-day and help us to make proper decisions to buy/ sell or exit as the market keeps churning out new information.
As regards to the Holy Grail- everyone has one- the one between your ears, provided you know how to use it wisely.
Nifty :

Bank Nifty :
Tuesday, January 18, 2011
Power of Profile
It's been my long held belief that if you are not looking at the markets through price and volume as a combination, you are in fact looking at the market through one eye!
Over the years, in chats with several traders I have found that those traders who watched volume alongside price always emerged more successful than the ones who followed only price and price based indicators.
There are several different ways of watching price and volume together and these are as varied as the different methods employed by successful traders over the globe in reaching the same objective-to be successful in their trading.
Surely in trading it's the ends not the means, and if you are successful then it does not matter.
But if you are still looking to get that edge to define your trading, and googling for a methodology or a trading system, then there is none better than Market Profile.
Consider these words from yesterday's post here :
If you have been studying profile , it wouldn't have been difficult to figure the 80 points from close to close. Or the fact that we stopped 3 points away from the 5745 level ( why ?) or the low of today was value area high from yesterday ( how ?).
I had posted a chart earlier on the impact value areas have on the motion of the markets.You can find that same chart here
These markets can be tamed and you can be profitable as much as any big institutional player or fund house.
You just have to choose the correct way.
Order Flow charts of today :
Nifty :

Bank Nifty :

Charts need to be read as blue for buyers and red for sellers. More details about OrderFlow are there in last night's post.
Over the years, in chats with several traders I have found that those traders who watched volume alongside price always emerged more successful than the ones who followed only price and price based indicators.
There are several different ways of watching price and volume together and these are as varied as the different methods employed by successful traders over the globe in reaching the same objective-to be successful in their trading.
Surely in trading it's the ends not the means, and if you are successful then it does not matter.
But if you are still looking to get that edge to define your trading, and googling for a methodology or a trading system, then there is none better than Market Profile.
Consider these words from yesterday's post here :
Both of them are forming bell shaped curves, indicating balance coming back to the markets.Whilst this does not discount the possibility of another sharp spike lower, today's action does indicate exhaustion of the dominant trend.
If the market needs to go down , it would be new sellers who will have to enter to bring it lower, but any good upmove will put 5745 and 5815-30 back in play.
If you have been studying profile , it wouldn't have been difficult to figure the 80 points from close to close. Or the fact that we stopped 3 points away from the 5745 level ( why ?) or the low of today was value area high from yesterday ( how ?).
I had posted a chart earlier on the impact value areas have on the motion of the markets.You can find that same chart here
These markets can be tamed and you can be profitable as much as any big institutional player or fund house.
You just have to choose the correct way.
Order Flow charts of today :
Nifty :

Bank Nifty :

Charts need to be read as blue for buyers and red for sellers. More details about OrderFlow are there in last night's post.
Monday, January 17, 2011
Trend Indicator Charts for today
Here are the orderflow charts of today from the trading room.
Nifty OF :

Bank Nifty OF :

I have received a number of emails on the subject of these orderflows.
I wish to touch on a few points.
1) Even though I use the word "indicator" to describe the OrderfLow, it actually is a trading system designed for trending & non-trending days in the market and even two types of intra-day traders.
2) The Order Flow is actually a trend indicator and one of the most powerful out there.
3) The flexibility we have is our advantage to see both of them work together in live markets and in different situations.It's like riding this market in 2 "gears". One needs to use the right gear whilst trading the market
4)The smaller green-pink is for range bound days and the larger Blue-red is for trending environments.Use the lower gear for range bound markets and the higher one for fast paced trending markets.
4) The Order Flow is the general buying and selling of the markets. The Markets are driven in the direction of the larger demand or supply.Since OrderFlow tracks changes to the same, it cannot go wrong.
5) The OrderFlow trend indicator system will work in all markets and every timeframe.The past two days of activity -trending & volatile on friday and non trending & volatile activity of today are the best barometers to check the utility of these systems.
Hope this clears the air.
Nifty OF :

Bank Nifty OF :

I have received a number of emails on the subject of these orderflows.
I wish to touch on a few points.
1) Even though I use the word "indicator" to describe the OrderfLow, it actually is a trading system designed for trending & non-trending days in the market and even two types of intra-day traders.
2) The Order Flow is actually a trend indicator and one of the most powerful out there.
3) The flexibility we have is our advantage to see both of them work together in live markets and in different situations.It's like riding this market in 2 "gears". One needs to use the right gear whilst trading the market
4)The smaller green-pink is for range bound days and the larger Blue-red is for trending environments.Use the lower gear for range bound markets and the higher one for fast paced trending markets.
4) The Order Flow is the general buying and selling of the markets. The Markets are driven in the direction of the larger demand or supply.Since OrderFlow tracks changes to the same, it cannot go wrong.
5) The OrderFlow trend indicator system will work in all markets and every timeframe.The past two days of activity -trending & volatile on friday and non trending & volatile activity of today are the best barometers to check the utility of these systems.
Hope this clears the air.
Wednesday, January 12, 2011
IIP and orderflow
Wednesday, December 15, 2010
Order Flow for today
Lots of queries, lots of emails and lots of discussion coming around the Order Flow systems we are employing in the Vtrender trading room.
A trader's forum has people inquiring about an "afl" for the system and elsewhere people are comparing it to moving average crossovers and what not.
We are amused.
We reserve our comments, happy in the belief that our traders are finding a way to "kick the habit of losing money in the markets".
I'm not even worried about the rate decision tomorrow. I'll buy the blue and sell on red.
The Nifty chart gave 5 trades today :

The bank Nifty chart was a simple sell at the morning, with a small whipsaw in the afternoon.

The 5 trades in the Nifty would have given you 80 + points today, enough to pay for an entire month at Vtrender !
The bank Nifty would have paid for a quarter with over 400 points on 1 lot.
Even if you trade one signal a day, rest assured you would not lose your subscription amount to Vtrender.
But then if you want to sit on the fence and keep analyzing, will you ever trade?
A trader's forum has people inquiring about an "afl" for the system and elsewhere people are comparing it to moving average crossovers and what not.
We are amused.
We reserve our comments, happy in the belief that our traders are finding a way to "kick the habit of losing money in the markets".
I'm not even worried about the rate decision tomorrow. I'll buy the blue and sell on red.
The Nifty chart gave 5 trades today :

The bank Nifty chart was a simple sell at the morning, with a small whipsaw in the afternoon.

The 5 trades in the Nifty would have given you 80 + points today, enough to pay for an entire month at Vtrender !
The bank Nifty would have paid for a quarter with over 400 points on 1 lot.
Even if you trade one signal a day, rest assured you would not lose your subscription amount to Vtrender.
But then if you want to sit on the fence and keep analyzing, will you ever trade?
Monday, December 13, 2010
Subscribe to:
Posts (Atom)