Just as a quick follow up to yesterday's orderflow charts posted in the evening.
The gold sell call was reversed at 5.30 pm and is currently up 1000 points in less than 1 full session.
The silver sell call was also reversed around 6.00 pm yesterday and is currently up over 2750 points.
I will post a screen shot of our trading room tomorrow.
Showing posts with label OF. Show all posts
Friday, August 26, 2011
Tuesday, August 23, 2011
Intra day OrderFlow
Here are the intra day charts for NF and BN.
Nifty august future :
Bank Nifty Aug Future :
Volume precedes price.
With NF at 4920, the volume OrderFlow showed short covering and a target of 4992. Now just 20 points away.
Nifty august future :
Bank Nifty Aug Future :
Volume precedes price.
With NF at 4920, the volume OrderFlow showed short covering and a target of 4992. Now just 20 points away.
Monday, June 13, 2011
NF OrderFlow
This morning, we had an orderflow which asked us to reverse overnight longs at 5462 in Futures, something which we did and booked profits at PS1 which wasa pre market level generated through market profile charts.
Subsequently we got a long signal at day PP0 level of 5562, a a position which is up 50 points already!
We also looking at a failed auction in the Nifty Futures. You can learn more about failed auctions here
The market may visit 5437 again this week in a 75 % probability scenario based on previous results, but if it doesn't then we will have a long term move on our hands, the roots of which we may have seen already.
Subsequently we got a long signal at day PP0 level of 5562, a a position which is up 50 points already!
We also looking at a failed auction in the Nifty Futures. You can learn more about failed auctions here
The market may visit 5437 again this week in a 75 % probability scenario based on previous results, but if it doesn't then we will have a long term move on our hands, the roots of which we may have seen already.
Wednesday, June 8, 2011
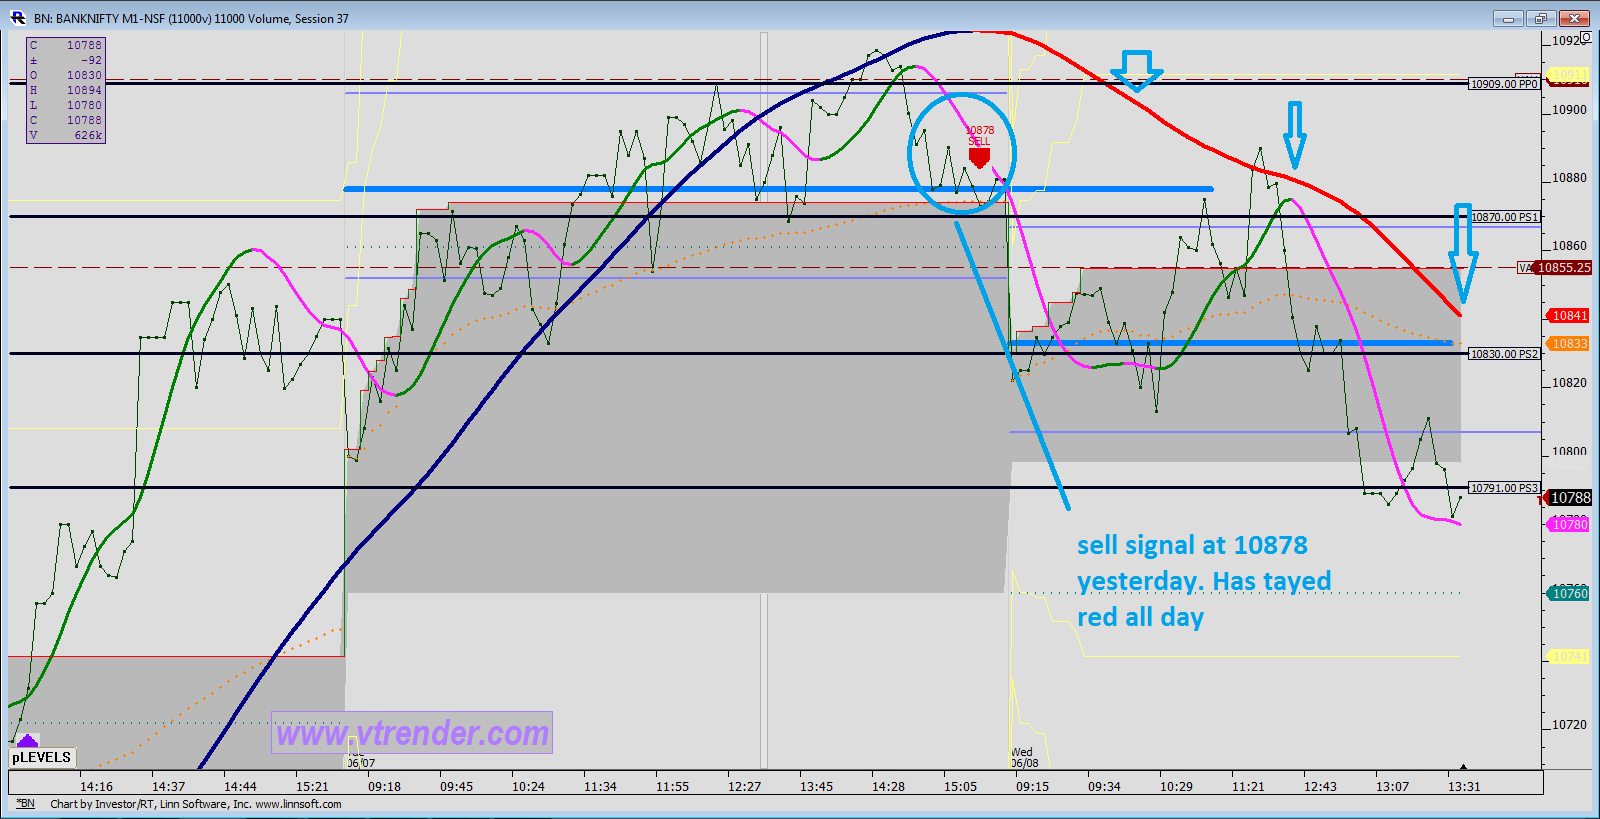
Order Flow for BankNifty
Yesterday in the BN intra day update we spoke about exiting longs at 10917 in BankNifty and waiting to see if OrderFlow confirmed our pre-market assessment.
We got a sell signal in the last few minutes of trade in the BN, a signal which stayed red all morning today confirming that sellers were in intra-day control for the moment. At the time of this post, the BN is down over 100 points from that signal and 10750 and 10790 are points to take some of the profits off.
Wednesday, March 23, 2011
Order Flow 23/03/2011
Here is the orderflow of today. The buying and selling of the market is depicted through the Blue/ red lines.
BankNifty :
Nifty :
More details on the use of these can be found on the right of the blog under "OrderFlow"
BankNifty :
Nifty :
More details on the use of these can be found on the right of the blog under "OrderFlow"
Thursday, March 17, 2011
Orderflow from yesterday
Wednesday, February 9, 2011
Order Flow : 9th Feb
By far, the most toughest place to make money in the markets is through intra day trading.
Relationship managers from brokerages would tell you how their phone diaries and email addresses need an updation every month, as clients drop off in many cases never to return to the markets again.
At Vtrender we understand the pressures of intra day trading, which is why we have worked on a system which will give you consistent results irrespective of the movement of prices on your screen.
You need to know only two things if you want to trade successfully intra-day :
a) Know the Trend
b) Know your reference levels.
The charts which we use to trade everyday have the best trend indicators as well as the best reference points, the industry uses today.
Take a look :

The points marked in blue are the reference points and the points marked in orange is the reaction of Order Flow ( Trend Indicator) at these points.
Point 1 ( Blue ) : 5264 given as a ref level even in the chat room here and was the low of the day till the afternoon news broke.We booked overnight shorts here.
Point 2 (Blue ) : POC- we noticed the market's reluctance to move above this level and waited for OF to confirm the red.
Point 3 ( Blue) : VAL- Notice OF going red again sending a clear message that sellers want action.
Point 4 ( blue ) : 5224 another HVN where we covered shorts and waited for the OF signal.
In The Bank Nifty :

Notice the high of the day is Value Area High and the Low of the day is another Important reference level. Notice how VWAP ( Orange Line ) helps to arrest the trend at numerous times during the day.
You do not need anymore. Trading is actually a simple job. It's information converted to knowledge which yield successful trades.
You have to have the right information though....
Relationship managers from brokerages would tell you how their phone diaries and email addresses need an updation every month, as clients drop off in many cases never to return to the markets again.
At Vtrender we understand the pressures of intra day trading, which is why we have worked on a system which will give you consistent results irrespective of the movement of prices on your screen.
You need to know only two things if you want to trade successfully intra-day :
a) Know the Trend
b) Know your reference levels.
The charts which we use to trade everyday have the best trend indicators as well as the best reference points, the industry uses today.
Take a look :

The points marked in blue are the reference points and the points marked in orange is the reaction of Order Flow ( Trend Indicator) at these points.
Point 1 ( Blue ) : 5264 given as a ref level even in the chat room here and was the low of the day till the afternoon news broke.We booked overnight shorts here.
Point 2 (Blue ) : POC- we noticed the market's reluctance to move above this level and waited for OF to confirm the red.
Point 3 ( Blue) : VAL- Notice OF going red again sending a clear message that sellers want action.
Point 4 ( blue ) : 5224 another HVN where we covered shorts and waited for the OF signal.
In The Bank Nifty :

Notice the high of the day is Value Area High and the Low of the day is another Important reference level. Notice how VWAP ( Orange Line ) helps to arrest the trend at numerous times during the day.
You do not need anymore. Trading is actually a simple job. It's information converted to knowledge which yield successful trades.
You have to have the right information though....
Wednesday, February 2, 2011
Nifty Intra Update
When you get a gap up, there is always a question mark on whether the gap will be closed or whether there will be continuation.
That dilemma to fade the gap or not to was deliberated at the open this morning.
So far this morning we have done well to stay with the gains and at the time of this post we have made it to the 5504 level, the scene of yesterday's breakdown.
OF is still blue off the open, but we have booked part longs near 5504.

Also we are introducing Reliance OrderFlow and SBI Order Flow charts to our trading room.
With lot sizes of 250 and 125, these will be handy instruments to trade on OF.
This is the morning action so far :
Reliance :

SBI :

Looking ahead to the day in the Nifty, we are waiting to see the auction process develop over 5505-5513 for yesterday's highs or whether 5466 lower down is protected.
The Bank Nifty is trading around the 3 day balance area of 10560 and will rotate here.Remember it is an inside day in the BN and a break-out will be an interesting development.
That dilemma to fade the gap or not to was deliberated at the open this morning.
So far this morning we have done well to stay with the gains and at the time of this post we have made it to the 5504 level, the scene of yesterday's breakdown.
OF is still blue off the open, but we have booked part longs near 5504.

Also we are introducing Reliance OrderFlow and SBI Order Flow charts to our trading room.
With lot sizes of 250 and 125, these will be handy instruments to trade on OF.
This is the morning action so far :
Reliance :

SBI :

Looking ahead to the day in the Nifty, we are waiting to see the auction process develop over 5505-5513 for yesterday's highs or whether 5466 lower down is protected.
The Bank Nifty is trading around the 3 day balance area of 10560 and will rotate here.Remember it is an inside day in the BN and a break-out will be an interesting development.
Subscribe to:
Posts (Atom)